SLV 20-day bearish forecast — Nov 8, 2026
- Bias: Bearish
- Timeframe: 20 days (made Nov 8, 2026, target date Nov 27, 2026)
- Price at analysis: $46.87
- Price target: $45.50
- Expected range: $43.20 – $48.20
- Result: Pending — graded after the close on Nov 27, 2026
Get a free AI analysis of SLV today
Analysis
TECHNICAL INDICATORS
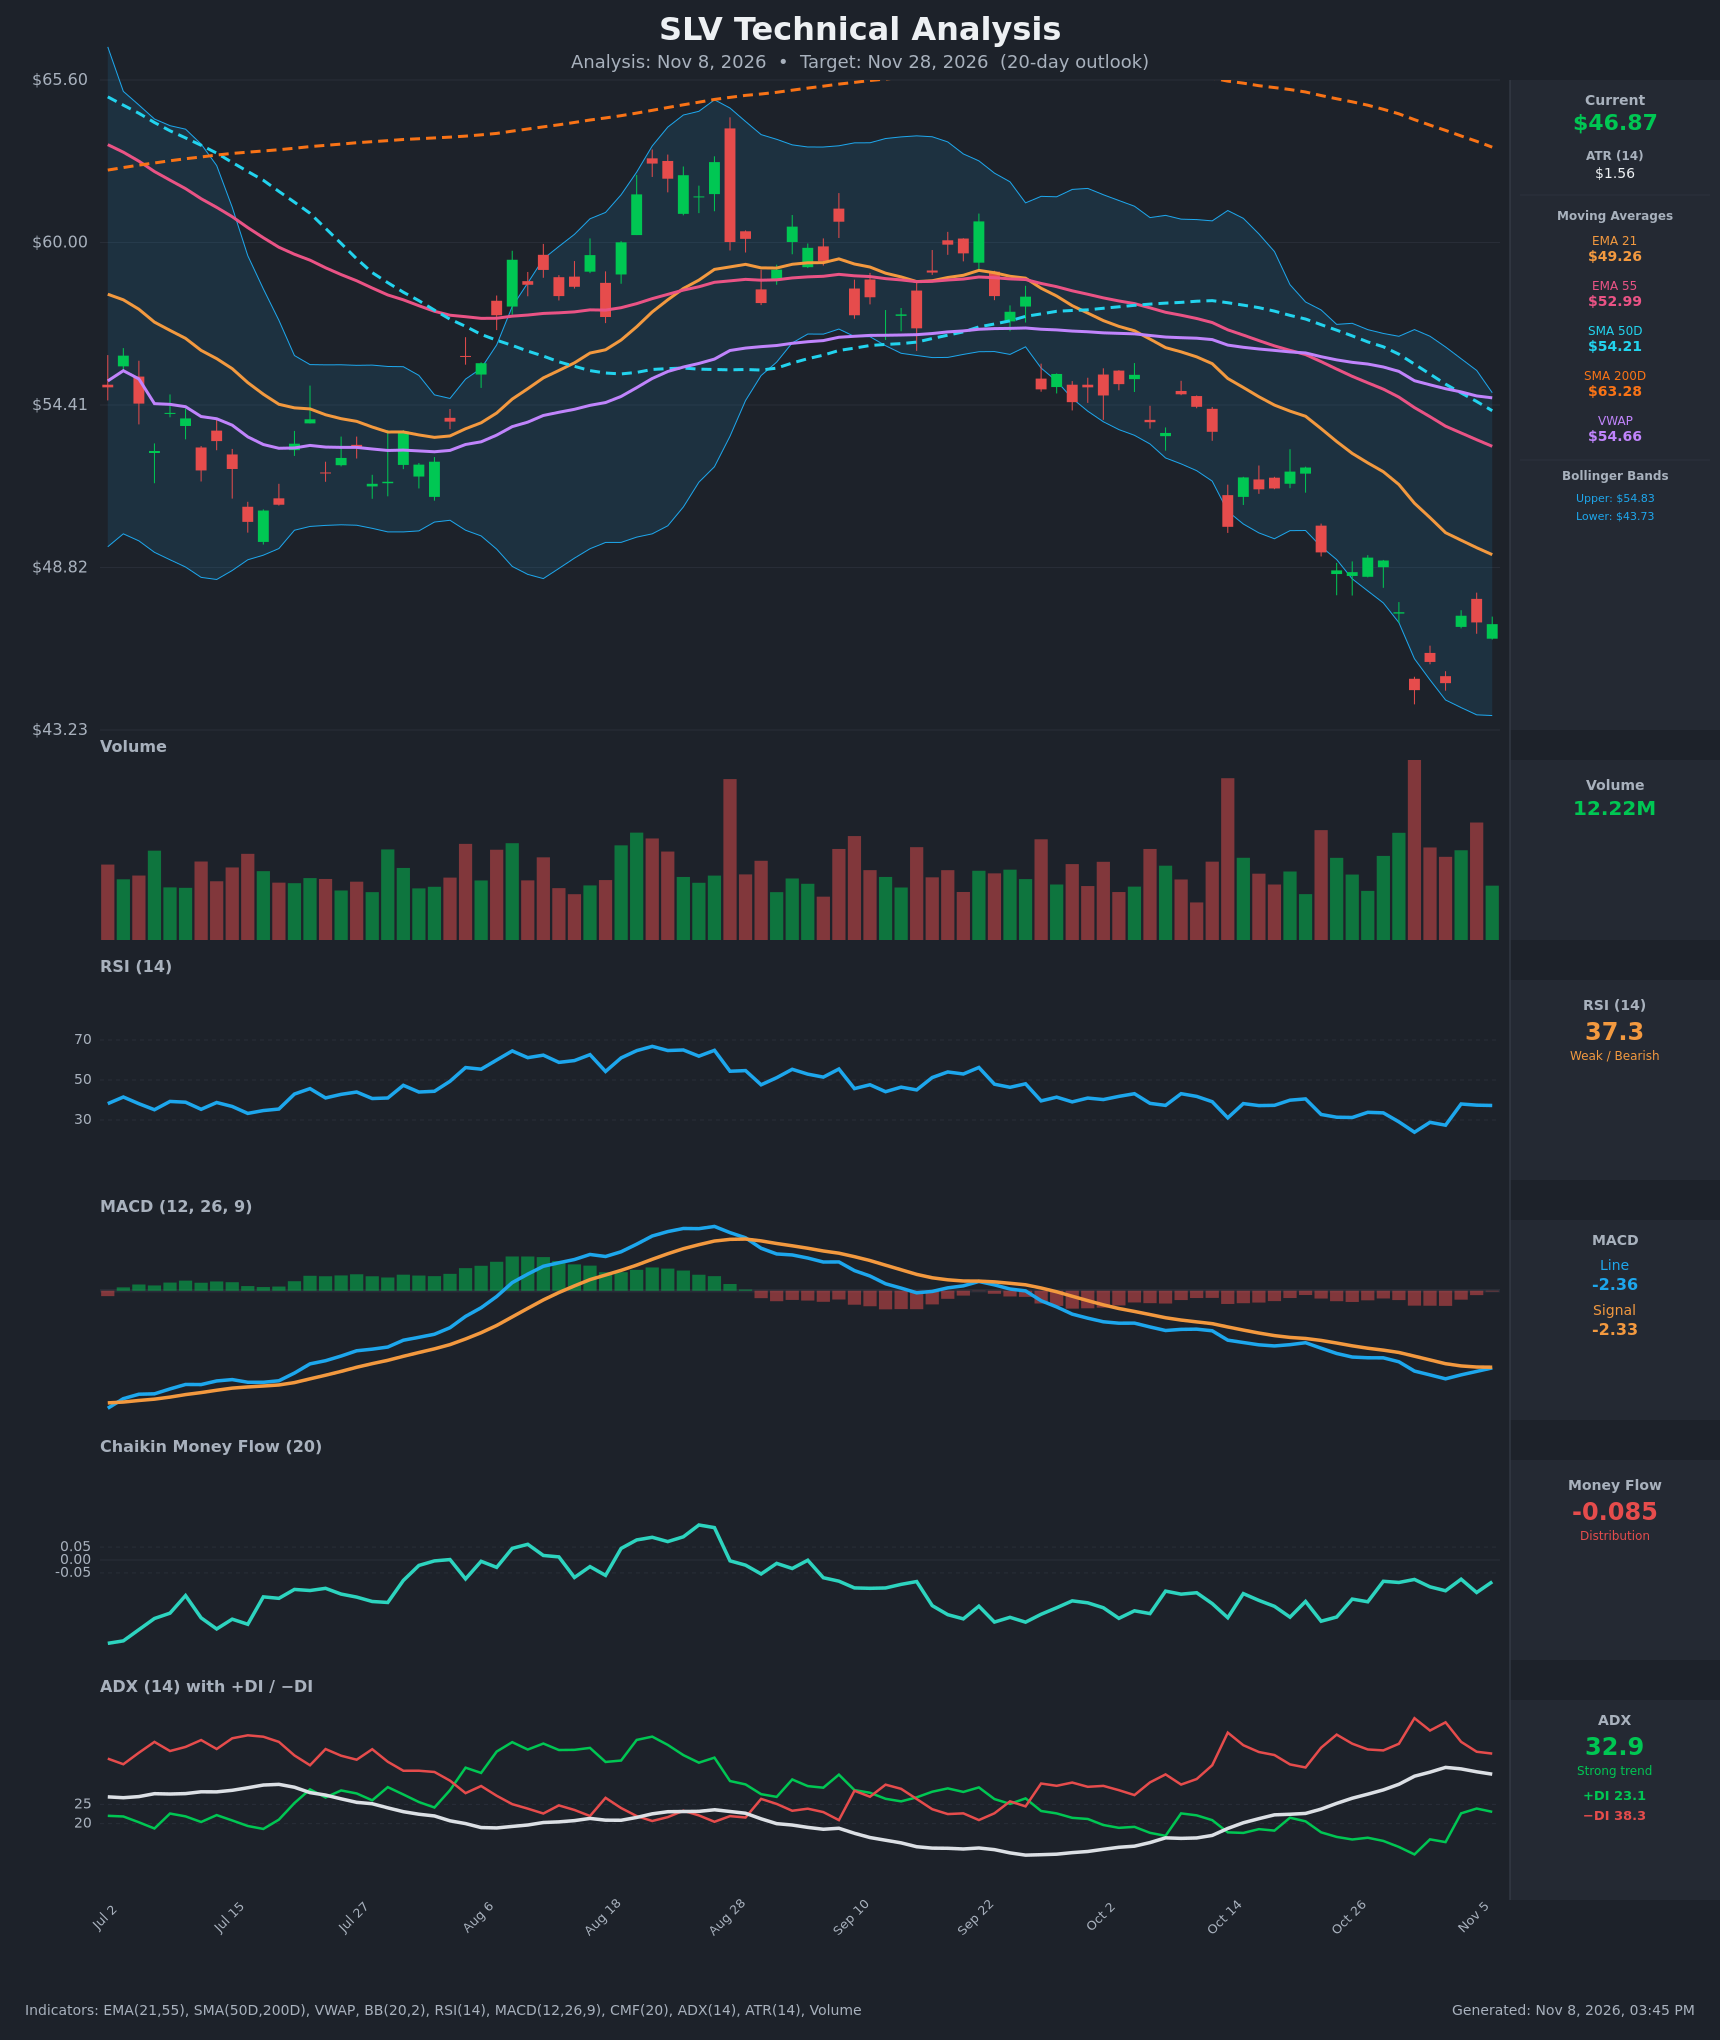
- RSI (14): 37.26. It bounced from a deeply oversold 23.9 on Oct 30 but has stalled in the high 30s, with no move above 40 since Oct 21. It is weak, not oversold, so the selloff has room to resume. [Bearish]
- 20 EMA: The 21 EMA is $49.26 and falling about $0.25 a day. Price at $46.87 is about 5% below it. The EMA stack is bearish (EMA21 $49.26 < EMA55 $52.99 < SMA50D $54.22 < SMA200D $63.28), and VWAP at $54.66 sits far overhead. Rallies toward $49 are likely to meet resistance. [Bearish]
- MACD: The line is -2.355 and the signal is -2.334, so the histogram is about -0.02 and nearly flat. The line has turned up from its Nov 3 low of -2.689 and is about to cross the signal from below. The cross would still happen well below zero, so it would be a weak relief signal rather than a trend change. [Neutral]
- Bollinger Bands (20): The upper band is $54.83, the lower is $43.73 and the midline is about $49.28. The bands are wide after the sharp decline. Price tagged and pierced the lower band on Oct 30 and has bounced into the lower third. It is still well below the midline, so the trend is down, but the bounce points to a mean-reversion attempt toward $49. [Bearish]
- CMF (20): -0.085 is below the -0.05 threshold. It has been negative for weeks and has not recovered with the bounce. That shows persistent distribution and weak buying conviction. [Distribution]
- ADX (14): 32.9 is above 25, so the trend is strong, though ADX has slipped from a peak of 34.7. −DI at 38.3 is well above +DI at 23.1, so bears are firmly in control. [Strong Trend – Bearish]
- Volume: 12.22M is moderate. The largest spike came on the Oct 30 capitulation drop, and the bounce since has come on average-to-lighter volume. That suggests a weak relief rally rather than aggressive accumulation. [Mildly Bearish]
DIVERGENCES & TRENDS
- RSI: There is a mild bullish divergence. Price made a similar low on Nov 3 ($44.84 vs $44.60 on Oct 30) while RSI printed a higher low (27.4 vs 23.9). It is small and unconfirmed, and RSI has not been able to regain 40.
- MACD: The histogram is shrinking and the line is turning up toward the signal. That is a momentum-deceleration signal, not a reversal.
- CMF and ADX: CMF has not confirmed the bounce, and −DI still dominates +DI. The price bounce is not backed by money flow.
- Moving averages: The SMA50D is far below the SMA200D (a long-standing death cross), and price is below SMA200D by about 26%. The long-term trend is clearly down. EMA21 is below EMA55 and both are still falling.
- Price structure: Lower highs and lower lows persist from the Sep peak. The latest bounce is capped below the $49 area (the Oct 28 level and EMA21).
CHART PATTERNS
- Bearish continuation / flag-type bounce: After a sharp leg down from about $52 to $44.60, the current small recovery resembles a bearish flag or pennant. A rejection at $48–49 would project a measured move toward $43 or lower.
- Possible Bullish Double Bottom: The lows at $44.60 and $44.84 form a tentative double bottom, with a neckline near $49 (the Oct 27–28 highs). It is incomplete until price closes above $49, and a break would target about $53. That is a counter-trend setup, and volume does not yet support it.
- Falling channel: The price series sits in a steep downward channel under a descending EMA21. The trend remains the dominant factor.
POTENTIAL SCENARIOS
- Scenario 1: Bearish Trend Resumption — The relief bounce fades at the falling 21 EMA and the $48–49 supply zone. Sellers regain control with −DI above +DI, CMF stays negative, and price retests the lows. Trigger: rejection at $48–49 or a close below $46.00. Target: $44.60, then $43.50 near the lower Bollinger Band. Invalidation: a daily close above $49.30 (EMA21) on rising volume. (50% probability)
- Scenario 2: Bullish Double-Bottom Relief Rally — The MACD bullish cross and RSI higher low drive a squeeze through the 21 EMA. Short covering pushes price up to the next resistance. Trigger: a close above $49.30 with CMF turning above 0. Target: $51.50–$53.00 (EMA55 at $52.99). Invalidation: a close below $44.60. (35% probability)
- Scenario 3: Neutral Range Chop — Price oscillates between $44.60 and $49.00 as the selloff exhausts. Trigger: failure of both the $49 breakout and the $44.60 breakdown. Target: $46–$48. Invalidation: a close outside $44.40–$49.30. (15% probability)
PRICE TARGETS
- Target Price: $45.50 (20-day horizon)
- Expected Range: $43.20 to $48.20 (width $5.00, about 10.7% of the current price, consistent with the 14–21 day guidance)
- Key Levels: Support at $44.60, Resistance at $49.26
OVERALL BIAS
OVERALL BIAS: BEARISH - Price is below every major moving average. −DI dominates with ADX at 32.9, CMF shows distribution, and the MACD and RSI are still below their neutral levels. The bounce is on light volume and faces resistance at the $49 EMA21, so a retest of the $44.60 low is more likely than a trend reversal, though the incipient double bottom and MACD cross make a relief rally a real risk.
This is educational analysis and not financial advice.