EEM 27-day bearish forecast — Nov 8, 2026
- Bias: Bearish
- Timeframe: 27 days (made Nov 8, 2026, target date Dec 4, 2026)
- Price at analysis: $59.33
- Price target: $57.50
- Expected range: $52.80 – $61.80
- Result: Pending — graded after the close on Dec 4, 2026
Get a free AI analysis of EEM today
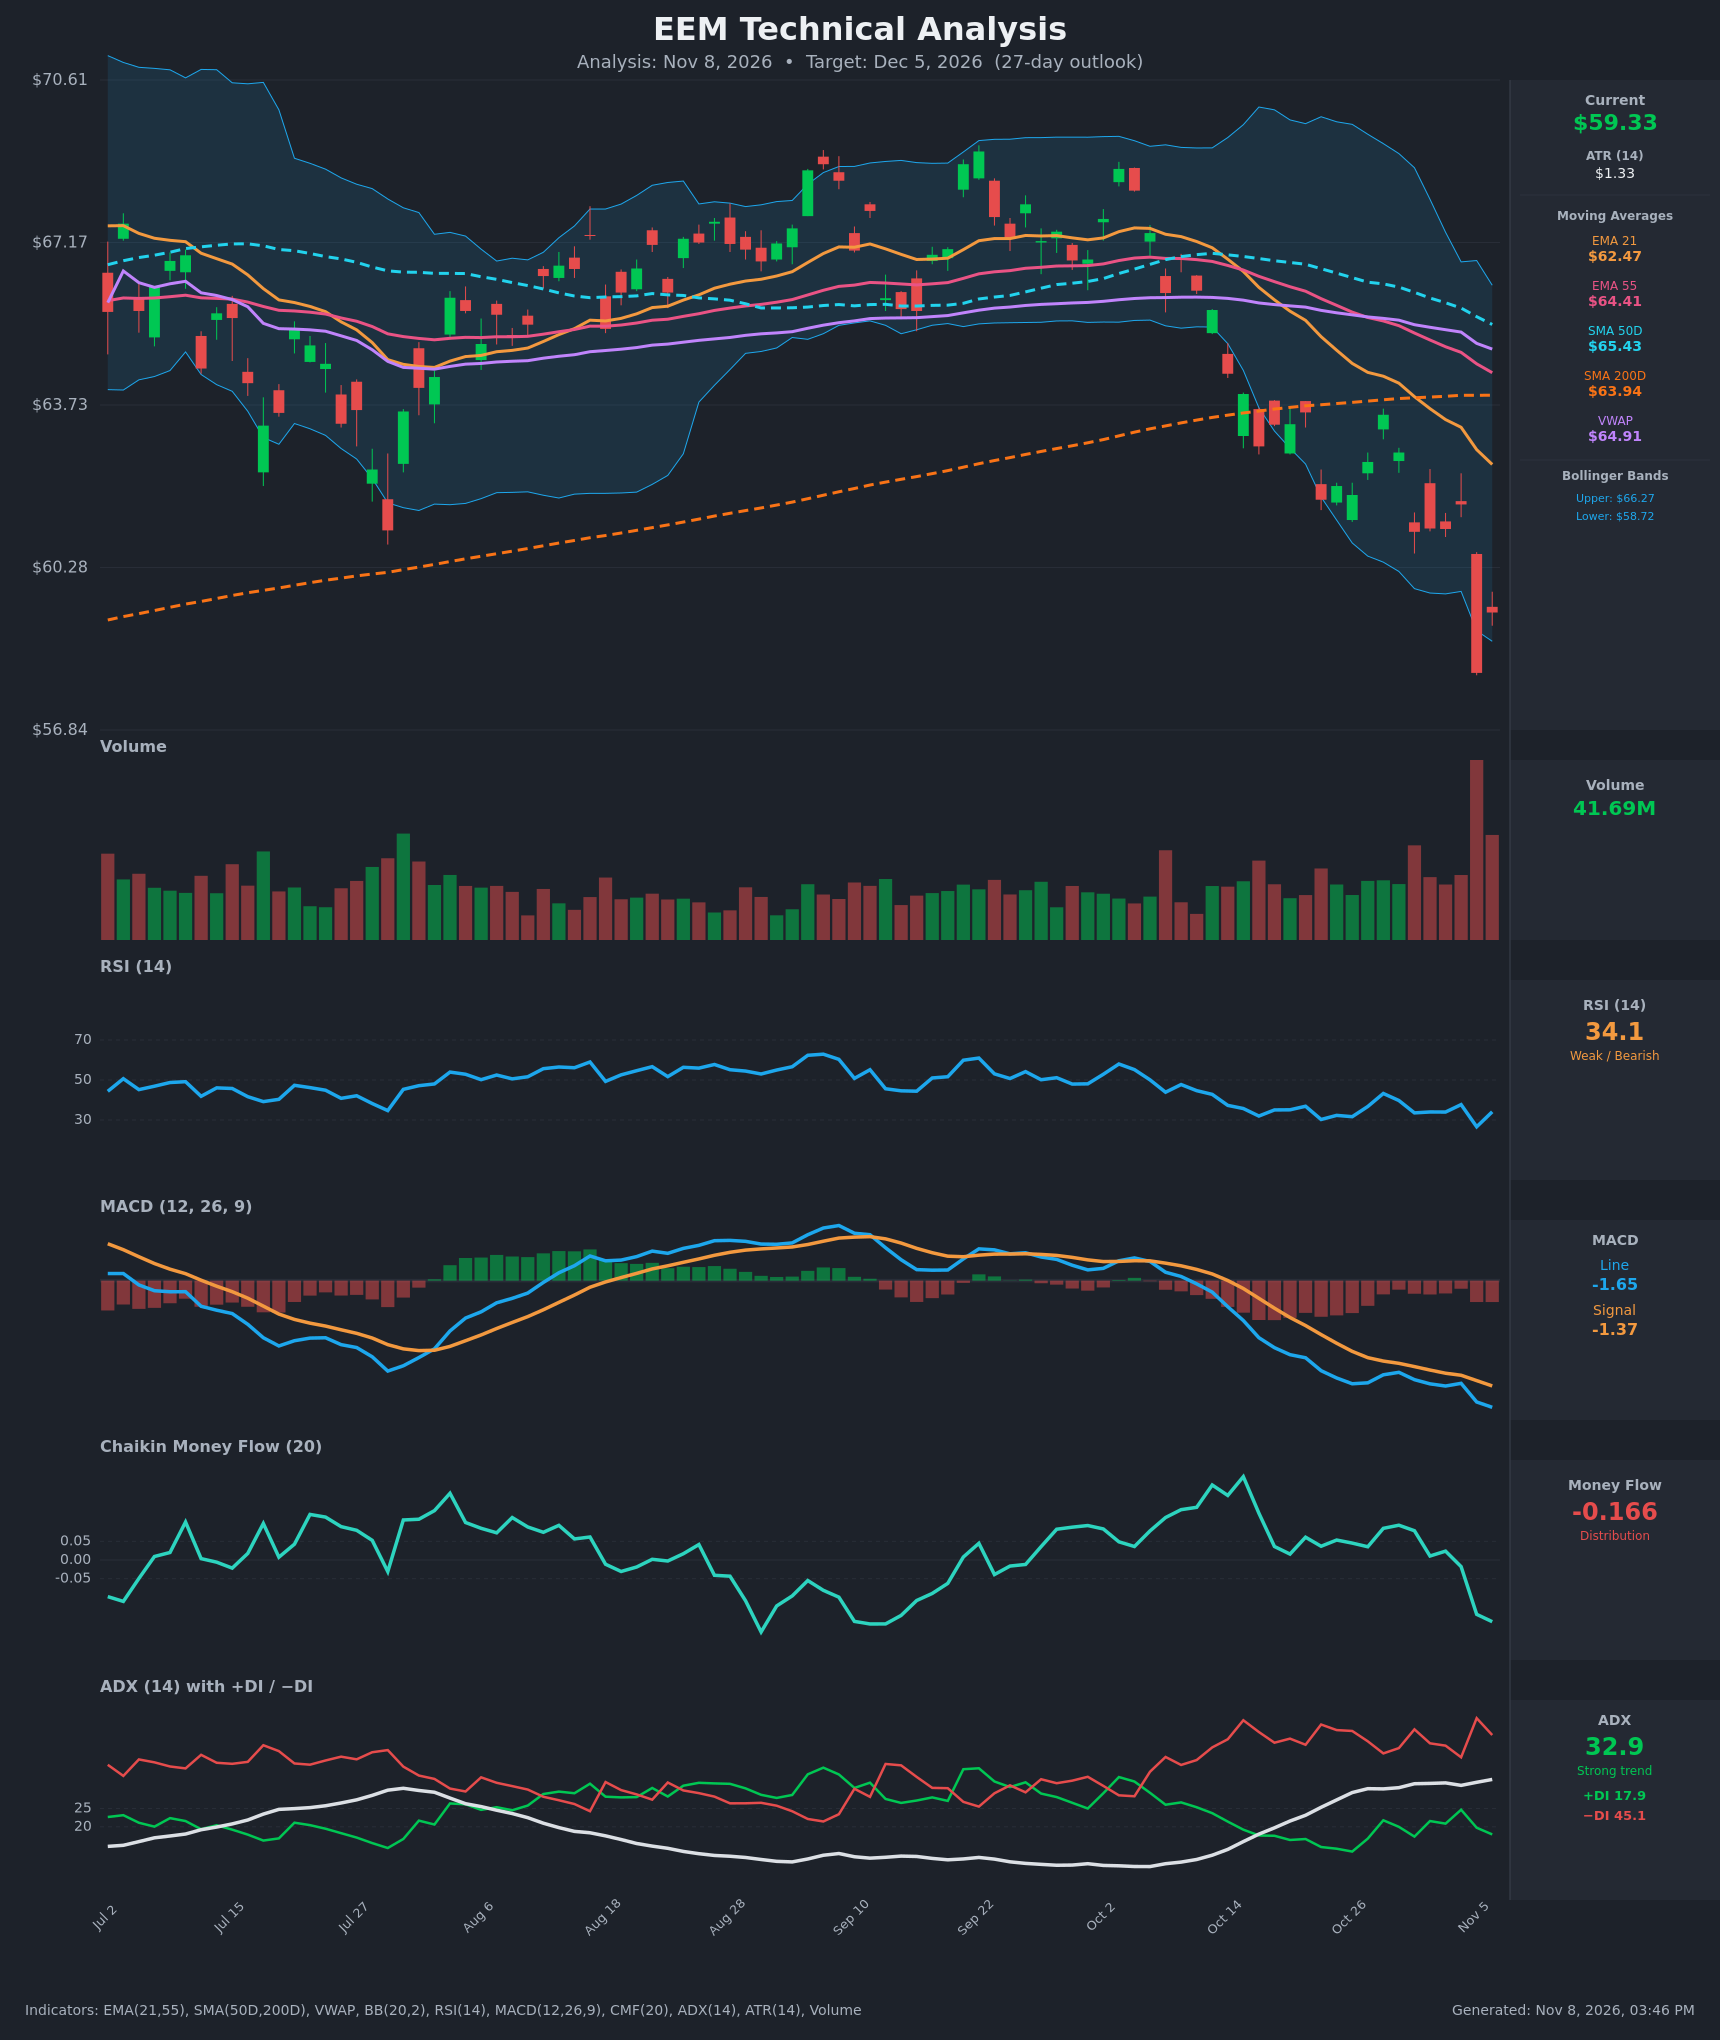
Analysis
TECHNICAL INDICATORS
- RSI (14): 34.10. It is near oversold but not below 30, and it just bounced from 26.6 on Nov 5. RSI has made lower highs and lower lows since mid-October and has stayed under 45 throughout, which shows persistent bearish momentum. The bounce is the only mitigating factor. [Bearish]
- 20 EMA: The chart uses the 21 EMA at $62.47, about 5% above price. It is falling steeply and has been below the EMA55 ($64.41) since early October. The EMA21 is now acting as overhead resistance. [Bearish]
- MACD: Line -1.646 is below Signal -1.368, and the histogram is negative at about -0.28 and widening. There has been no bullish crossover, and the line is making new lows. [Bearish]
- Bollinger Bands (20): Price of $59.33 sits just above the lower band at $58.72 (upper $66.27). The Nov 5 candle pierced the lower band. The bands are widening, which signals a volatility expansion to the downside. Walking the band is a trend-continuation sign, though a mean-reversion bounce is possible. [Bearish]
- CMF (20): -0.166, well below the -0.05 threshold. It fell sharply from roughly +0.05 to -0.17 in the last three bars, which shows aggressive distribution on the breakdown. [Distribution]
- ADX (14): 32.9 and rising, which means a strong trend. -DI (45.1) is far above +DI (17.9), so bears are firmly in control. [Strong Trend – Bearish]
- Volume: 41.69M. The Nov 5 capitulation-style red candle printed the highest volume of the whole chart, and the bounce volume is also elevated. Heavy volume on the breakdown confirms selling conviction. It could also mark a short-term exhaustion point. [Bearish with bounce risk]
DIVERGENCES & TRENDS
- There is no bullish RSI or MACD divergence. Both made new lows alongside price, so momentum confirms the decline.
- Price is below the VWAP ($64.91), EMA21, EMA55, SMA50 ($65.43) and now SMA200 ($63.94). The SMA200 was lost decisively in late October and now acts as resistance.
- EMA21 has been below EMA55 since the Oct 14 area (a bearish crossover). SMA50 ($65.43) is falling toward the flat SMA200 ($63.94), so a death cross is plausible within the window.
- The SMA50 to SMA200 gap has narrowed from about $3.1 to $1.5 in 15 bars.
- ADX rose from 19.7 to 32.9 while -DI stayed above 40, so the trend is accelerating.
- MACD has no bullish crossover. Its histogram turned slightly negative again, showing renewed downside momentum.
- The Nov 5 flush to about $58 and the subsequent bounce to $59.33 is the first sign of potential short-term exhaustion.
CHART PATTERNS
- Bearish Flag/Pennant (continuation): From Oct 22 to Nov 4 price consolidated in a tight, slightly rising range of about $61–63.5 after the drop from the high $60s. It then broke down on Nov 5 on heavy volume. The measured move from the roughly $4 pole below the $61 break points to about $57.
- Broad bearish top (reversal): The Jul–Oct range of about $62–68.5 had repeated failures near $68, including lower highs in September and October. The break below the range floor and the SMA200 completes a large distribution structure. The measured move of about $6 from the $63 breakdown points to roughly $57.
- The Bearish Rising Wedge on the reference diagram is not a clear match here.
POTENTIAL SCENARIOS
- Scenario 1: Bearish Trend Continuation — Price fails to reclaim the broken support and flag area near $61–62.5, and the bearish structure drives price lower. Trigger: a daily close below $58.00 (the Nov 5 low zone), with −DI staying above 40 and CMF staying negative. Target: $56.50–$57.50, with an extension toward $55 in a weak market. Invalidation: a daily close above $62.50 (EMA21). (55% probability)
- Scenario 2: Bullish Oversold Relief Bounce — The capitulation candle and the lower Bollinger Band touch trigger a mean-reversion rally into the broken-support cluster. Trigger: a close above $61.00 with RSI back above 45 and MACD histogram flattening. Target: $62.50–$63.90 (EMA21 and SMA200 resistance). Invalidation: a close below $58.00. (30% probability)
- Scenario 3: Neutral Base Building — Price chops in a range near the lows as selling exhausts without a rebound. Trigger: ADX rolling over and price holding $57.50–$61. Target: $58–$61. Invalidation: a close outside $57.00–$62.00. (15% probability)
PRICE TARGETS
- Target Price: $57.50 (27-day horizon)
- Expected Range: $52.80 to $61.80. The width is $9.00, about 15.2% of the current price, in line with the 12–18% guidance for 30–60 days and scaled to 27 days.
- Key Levels: Support at $58.00, Resistance at $62.47
OVERALL BIAS
OVERALL BIAS: BEARISH - Price is below every moving average including the SMA200, with ADX at 32.9 and −DI dominating, a negative MACD, CMF at -0.166 and a high-volume breakdown from a bear-flag structure. The oversold RSI and lower-band touch raise the risk of a bounce, but the weight of evidence favors continuation toward about $57.50.
This is educational analysis and not financial advice.