GLD 27-day bearish forecast — Nov 8, 2026
- Bias: Bearish
- Timeframe: 27 days (made Nov 8, 2026, target date Dec 4, 2026)
- Price at analysis: $372.52
- Price target: $365.00
- Expected range: $346.00 – $396.00
- Result: Pending — graded after the close on Dec 4, 2026
Get a free AI analysis of GLD today
Analysis
TECHNICAL INDICATORS
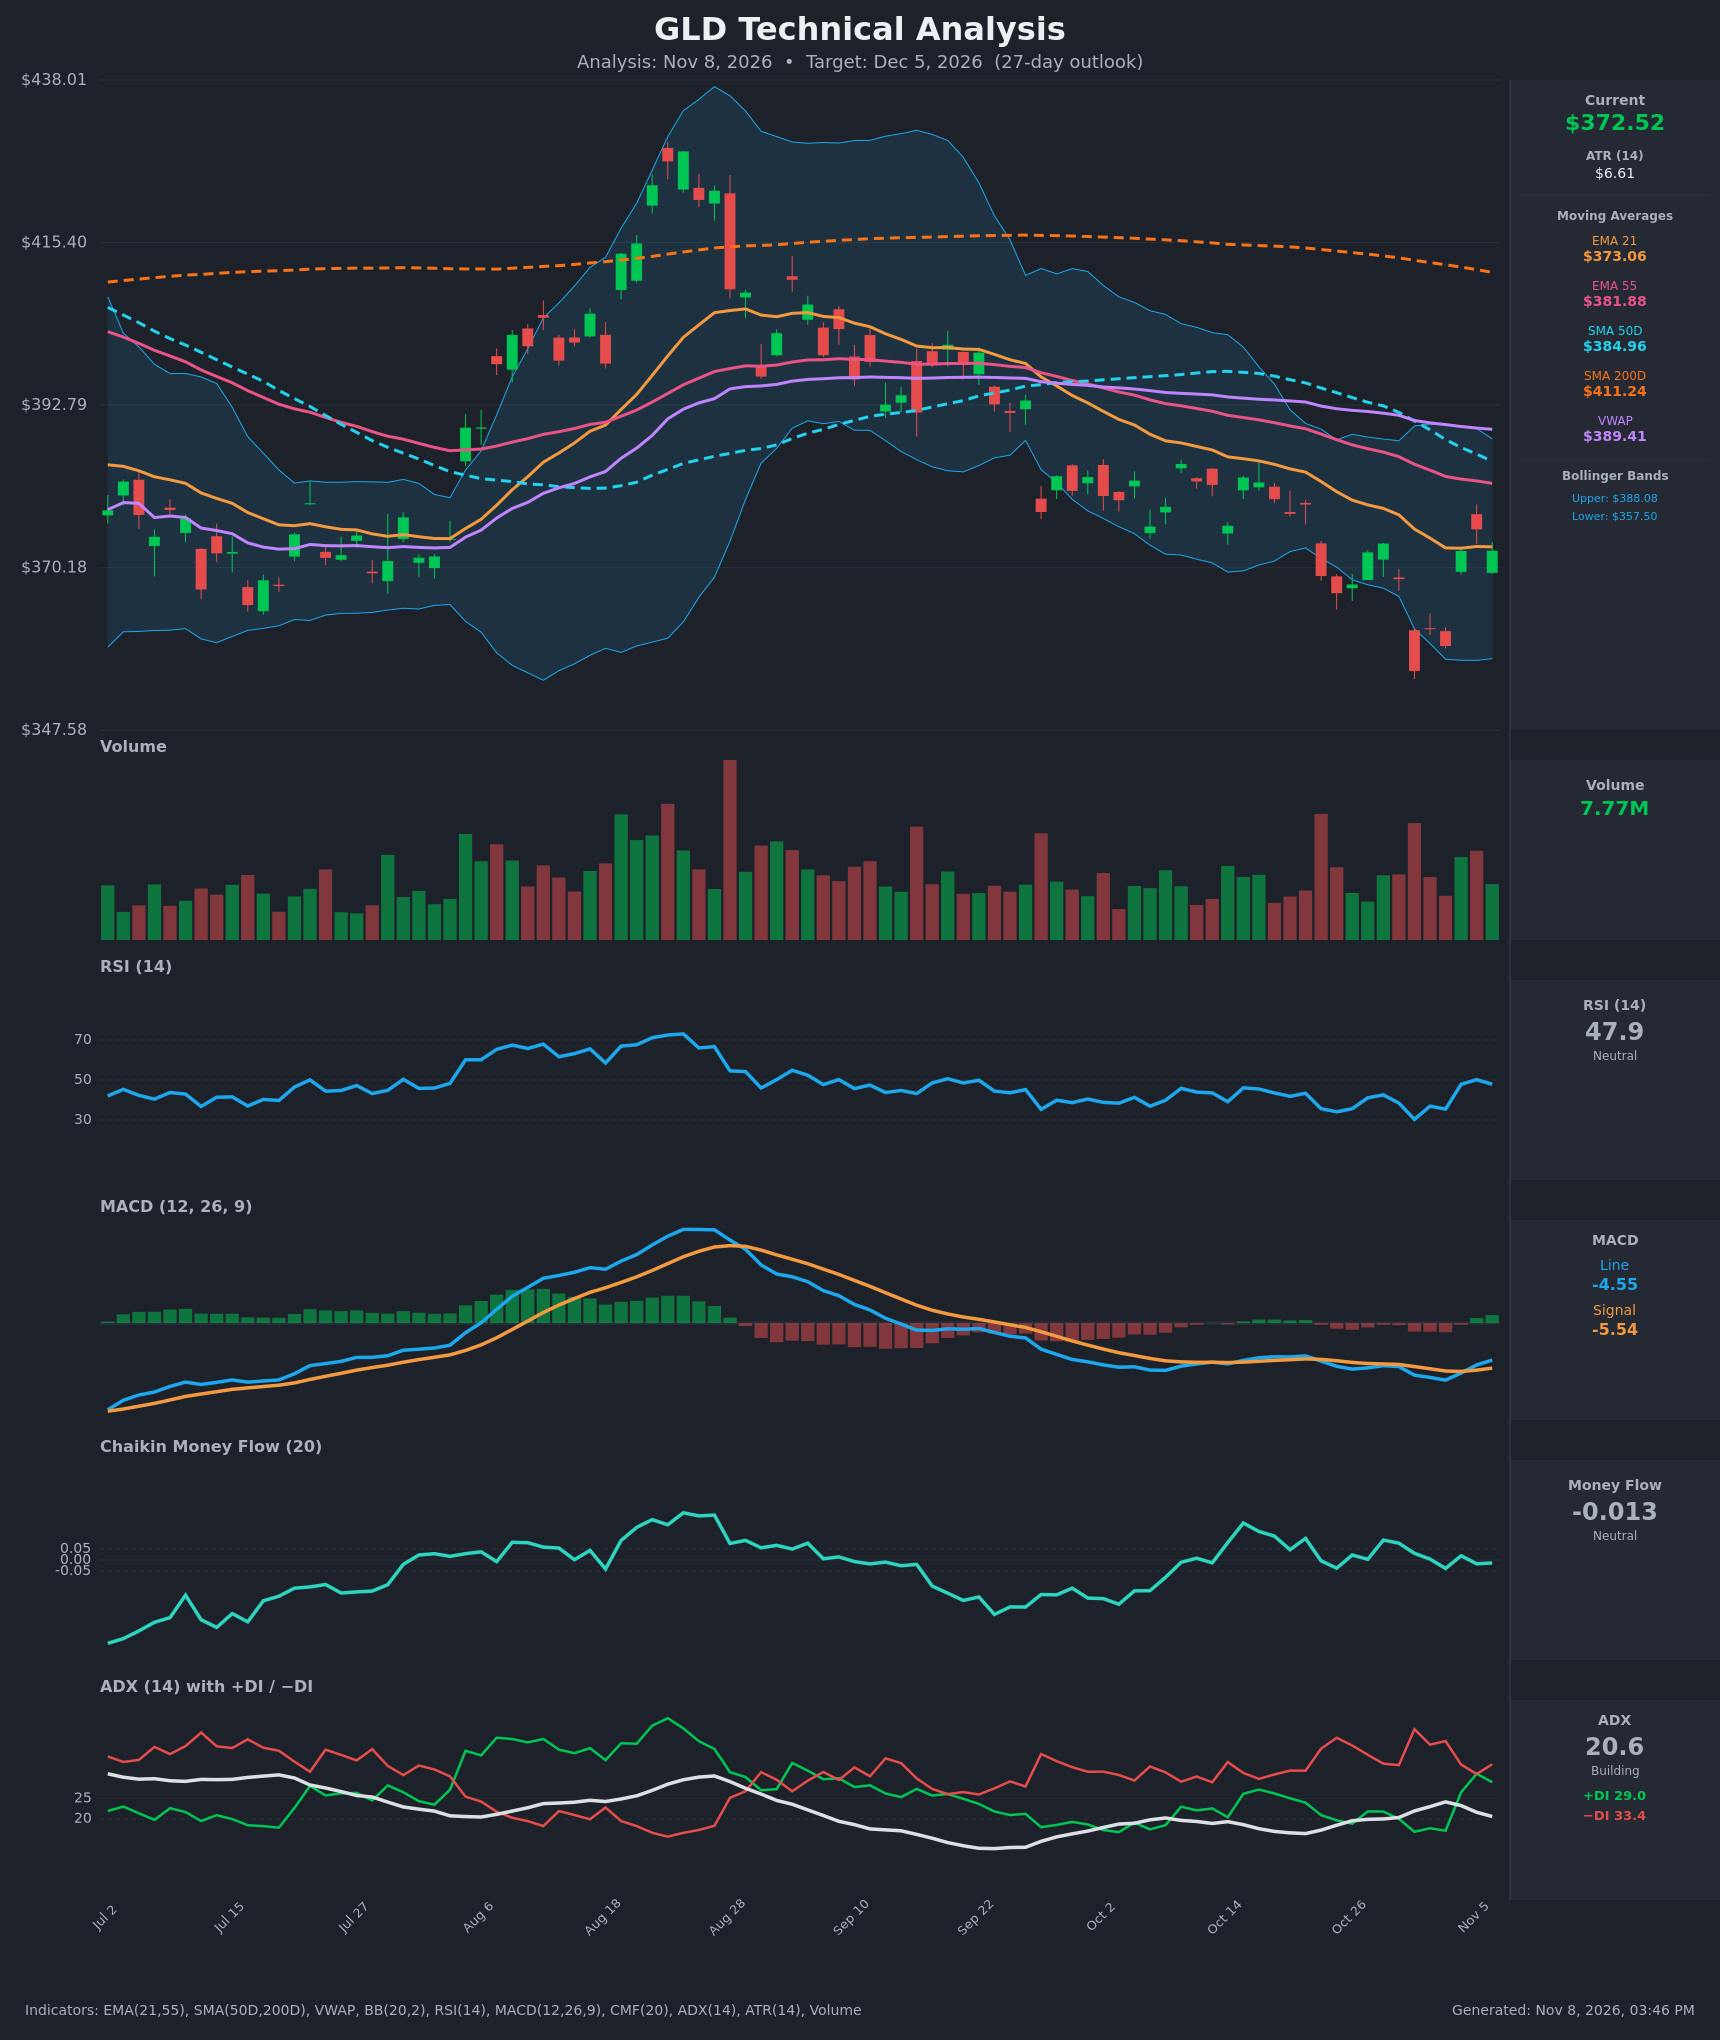
- RSI (14): 47.89, neutral. It bounced from an oversold 30.3 on Oct 30 to a 50.2 peak on Nov 5 and has now slipped back below 50. The recovery has stalled at the midline. [Neutral]
- 20 EMA: The EMA 21 is $373.06 and price ($372.52) sits just below it, so it is flat-to-slightly-falling resistance. The EMA 21 is also below the EMA 55 ($381.88), which keeps the short-term structure bearish. [Bearish]
- MACD: The line (-4.55) crossed above the signal (-5.54) on Nov 4-5 and the histogram has turned positive, but all of it is below zero. It is a bullish crossover inside a bearish regime, which makes it a relief bounce signal rather than a trend reversal. [Neutral]
- Bollinger Bands (20): Upper $388.08, lower $357.50, midline about $372.8. Price is sitting on the midline after bouncing off the lower band (Oct 30 low $355.78). The bands are contracting, which points to a pending volatility expansion. [Neutral]
- CMF (20): -0.013, inside the ±0.05 neutral zone. It has drifted from +0.1 in mid-October to roughly zero, so buying pressure has faded without real distribution showing up. [Neutral]
- ADX (14): 20.6 and falling from 24.1, so the trend is weak. −DI (33.4) is above +DI (29.0), though the gap has narrowed sharply from 20+ points. Bears are still marginally in control, but the trend is losing strength. [Weak Trend, Bearish lean]
- Volume: 7.77M on the latest up bar, around average. The biggest volume spikes were on red days (late-October selloff), while the rebound has come on unremarkable volume. That is not strong confirmation of a bullish reversal. [Neutral-to-Bearish]
DIVERGENCES & TRENDS
- Price made a lower low on Oct 30 ($355.78). RSI, MACD and CMF did not collapse proportionally, so there is mild momentum stabilization, but no clean bullish divergence.
- The SMA 50 ($384.96) is below the SMA 200 ($411.24), a death cross that is already in place. The EMA 21 is below the EMA 55 and both are below the SMA 50. All moving averages are stacked bearishly.
- Price is below the SMA 200, EMA 55, SMA 50 and VWAP ($389.41), so the long-term trend is down since the ~$428 peak in late August.
- The MACD bullish crossover has not been confirmed by price, which is stuck at the EMA 21. The EMA 21 is the immediate pivot.
- The DI spread is narrowing (+DI rose from 16.8 to 29.0) while ADX falls. This is a transition or range-forming phase, not a strong trend.
CHART PATTERNS
- Bearish Flag / Descending structure (continuation): Since the September peak the sequence of lower highs (~$390 → ~$385 → ~$376) and lower lows ($355.78) is consistent with a down-sloping channel. The current bounce looks like a corrective rally within it. A break below $355 would project toward roughly $345-$348.
- Possible Bullish Falling Wedge / Double Bottom (low confidence): The lows near $366 (Oct 23) and $355-$359 (Oct 30 / Nov 3) could form a base. This needs a close above $382-$385 to confirm, with a measured move toward $395-$400.
- The bearish structure has the edge because the bounce is stalling at declining resistance and the moving averages are stacked overhead.
POTENTIAL SCENARIOS
- Scenario 1: Bearish Rejection at EMA Resistance — Price fails at the EMA 21 / Bollinger midline, the weak MACD crossover rolls over, and −DI keeps the edge. Price drifts to retest the $355-$358 lower band and may undercut it. Trigger: daily close below $366 (Oct 23 low area). Target: $355-$358, with an extension to $348. Invalidation: daily close above $382 (EMA 55). (45% probability)
- Scenario 2: Bullish Relief Rally / Base Breakout — The MACD crossover and RSI recovery carry through, and price reclaims the EMA 55 and approaches the SMA 50 and upper Bollinger Band. Trigger: close above $382 on rising volume. Target: $389-$395 (VWAP and upper band). Invalidation: close back below $366. (35% probability)
- Scenario 3: Neutral Range Chop — With ADX below 20 and contracting bands, price oscillates between $358 and $382. Trigger: failure to close beyond either boundary. Target: $365-$378. Invalidation: close outside $355-$384. (20% probability)
PRICE TARGETS
- Target Price: $365.00 (27-day)
- Expected Range: $346.00 to $396.00 (width $50, about 13.4% of the current price, within the 12-18% guidance for 30-60 days and scaled for 27 days)
- Key Levels: Support at $355.78, Resistance at $381.88
OVERALL BIAS
OVERALL BIAS: BEARISH - The long-term trend is down, with price below the SMA 200, SMA 50 and EMA 55, a death cross in place, and −DI still above +DI. The bounce is stalling at the EMA 21 on average volume, and the sub-zero MACD crossover looks more like a relief rally than a reversal. Conviction is modest because RSI and CMF are neutral and a break above $382 would shift the odds.
This is educational analysis and not financial advice.