IREN 27-day bearish forecast — Nov 8, 2026
- Bias: Bearish
- Timeframe: 27 days (made Nov 8, 2026, target date Dec 4, 2026)
- Price at analysis: $21.64
- Price target: $19.75
- Expected range: $18.00 – $21.50
- Result: Pending — graded after the close on Dec 4, 2026
Get a free AI analysis of IREN today
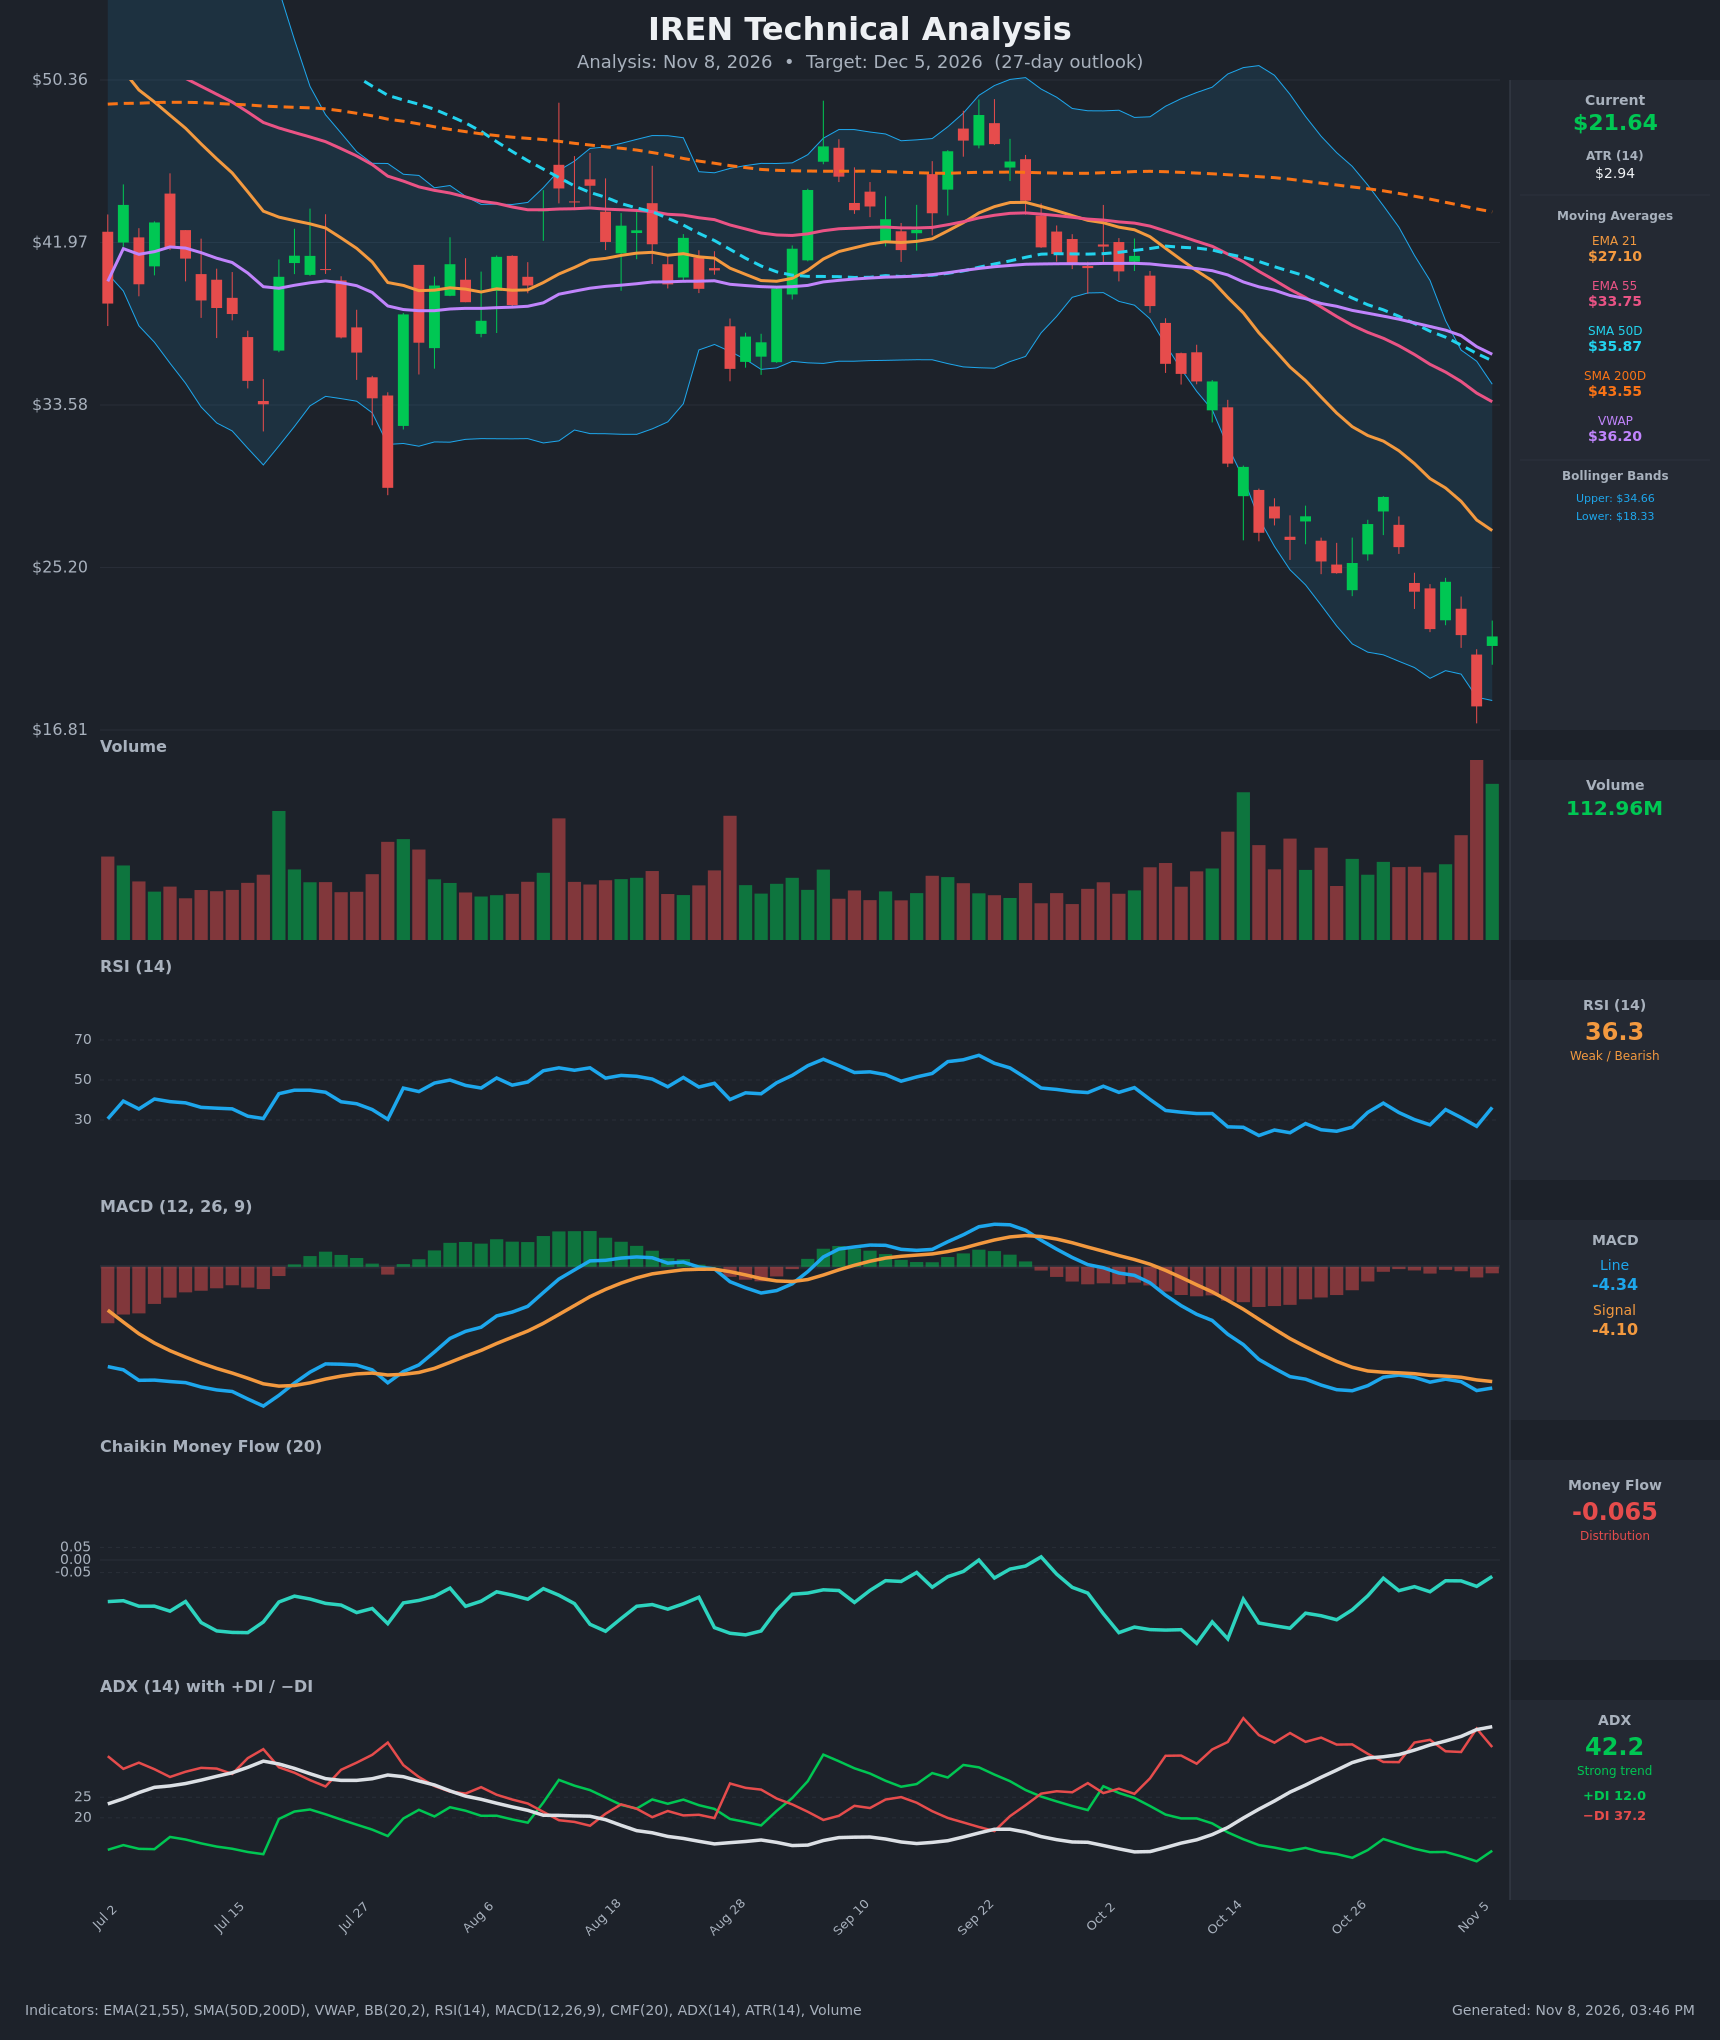
Analysis
TECHNICAL INDICATORS
- RSI (14): 36.29, up from 26.8 the prior bar and bouncing off oversold. It has stayed mostly below 40 for three weeks and sits below the 50 midline, so momentum is still weak and the bounce is not yet a trend change. [Bearish]
- 20 EMA (EMA 21 is the value supplied): $27.10. Price is about 20% below it, and the EMA is falling steeply (about $36.4 to $27.1 in 15 bars). It is dynamic resistance, and EMA21 is also below EMA55 ($33.75). [Bearish]
- MACD: Line -4.335 is below Signal -4.103, with a small negative histogram of about -0.23. The line made a new low of -4.43 on Nov 5 and has not crossed back above the signal, though the histogram is flattening. [Bearish]
- Bollinger Bands (20): Upper $34.66, lower $18.33, midline about $26.5. Price closed below the lower band on Nov 5 ($18.03), then snapped back inside to $21.64. The bands are wide and expanding, which points to a high-volatility, trending downside move. A band-walk followed by a reversal bar raises the odds of a relief bounce, but trend moves often resume. [Bearish]
- CMF (20): -0.065, just beyond the -0.05 distribution threshold. It has improved from -0.27 (Oct 20) and hovers around -0.08 to -0.10, so selling pressure is easing but not yet accumulation. [Distribution]
- ADX (14): 42.2 and rising steadily (24 to 42 in 15 bars), with −DI 37.2 far above +DI 12.0. This is a strong, mature downtrend with bears firmly in control. ADX above 40 can also signal trend exhaustion, but it needs +DI to turn up to confirm. [Strong Trend – Bearish]
- Volume: 112.96M, among the heaviest in the visible window, on a green bounce candle after an equally heavy red capitulation bar on Nov 5. This looks like a possible selling climax with dip-buying, but a single bar is not confirmation. [Potential capitulation / unconfirmed bounce]
Price is below SMA50D ($35.87), SMA200D ($43.55) and VWAP ($36.20). SMA50D is already below SMA200D, so the death cross is in place and the long-term trend is down.
DIVERGENCES & TRENDS
- Mild bullish RSI divergence: price made a new low at $18.03 versus $24.91 on Oct 23, while RSI printed 26.8 versus 24.4. MACD also made only a marginally lower low. This hints at fading downside momentum but is not a confirmed reversal.
- CMF: it has trended up from -0.27 to -0.065 while price kept falling, which suggests seller exhaustion.
- Trend indicators: all remain bearish. ADX is rising, −DI is dominant, the EMAs, SMAs and VWAP are stacked above price in descending order, and the MAs are still sloping down.
- No bullish crossovers yet: MACD has not crossed up, +DI has not crossed above −DI, and price has not reclaimed the EMA21. The last bar is only a counter-trend bounce.
- Recent range: price has made a series of lower highs ($28.84 on Oct 28, $24.46 on Nov 3), which keeps the downtrend structure intact.
CHART PATTERNS
- The dominant structure is a persistent downtrend / descending channel that follows a breakdown from the $40–$46 consolidation. It is a bearish continuation structure, with prior support at $35–$41 now resistance.
- The sideways, lower-high chop from Oct 22 to Nov 4 (about $22–$29) resembles a Bearish Flag/Pennant continuation. Its break lower to $18.03 projects further downside, but that measured move has already largely played out.
- The Nov 5 flush below the lower band and reversal on heavy volume resembles a Bullish Falling Wedge / capitulation. It would only be confirmed on a close above about $24.50 (Nov 3 close and the lower-high resistance) and then the EMA21 near $27.
- Targets: a relief rally could reach $24.5–$27.1 (EMA21). A continuation would retest $18.03, and a break of it would open $15–$16.
POTENTIAL SCENARIOS
- Scenario 1: Bearish Trend Resumption — The Nov 6 bounce fades as a dead-cat rally into falling EMA21 resistance and overhead supply. Strong ADX and −DI dominance favour continuation, and price retests the lows. Trigger: rejection below $23–$24.50, or a close back under $20. Target: $18.00–$19.50, with an extension to $16.50 if $18.03 breaks. Invalidation: a daily close above $24.50 with MACD crossing above its signal line. (50% probability)
- Scenario 2: Bullish Relief Rally — A capitulation-volume reversal at the lower Bollinger Band, with a bullish RSI divergence and improving CMF, leads to a mean-reversion bounce toward the middle band and EMA21. Trigger: a close above $24.50 on solid volume and +DI turning up. Target: $25.50–$27.10 (EMA21 and Bollinger midline). Invalidation: a close below $18.03. (35% probability)
- Scenario 3: Neutral Base Building — Price chops between roughly $18.5 and $23.5 as selling exhausts but buyers lack follow-through. Trigger: volume dries up and ADX rolls over. Target: $20–$22. Invalidation: a break above $24.50 or below $18.03. (15% probability)
PRICE TARGETS
Range width: $21.50 − $18.00 = $3.50, which is 16.2% of the current price. That is within the roughly 12–18% guidance for a 27-day window. The range is skewed to the downside because of the bearish trend, even though the bounce could extend higher in the bullish scenario.
- Target Price: $19.75 (27 days, around Dec 5, 2026)
- Expected Range: $18.00 to $21.50
- Key Levels: Support at $18.03, Resistance at $24.50
OVERALL BIAS
OVERALL BIAS: BEARISH - ADX of 42 with −DI (37.2) far above +DI (12.0), price below every moving average and VWAP, a death cross already in place, and a MACD still under its signal line favour trend continuation. The heavy-volume bounce and mild RSI/CMF divergences make a relief rally likely, but without a close above $24.50 or a bullish MACD/DI crossover it is more likely to fade, so conviction is moderate.
This is educational analysis and not financial advice.