MSTR 27-day bearish forecast — Nov 8, 2026
- Bias: Bearish
- Timeframe: 27 days (made Nov 8, 2026, target date Dec 4, 2026)
- Price at analysis: $128.93
- Price target: $121.00
- Expected range: $112.00 – $131.00
- Result: Pending — graded after the close on Dec 4, 2026
Get a free AI analysis of MSTR today
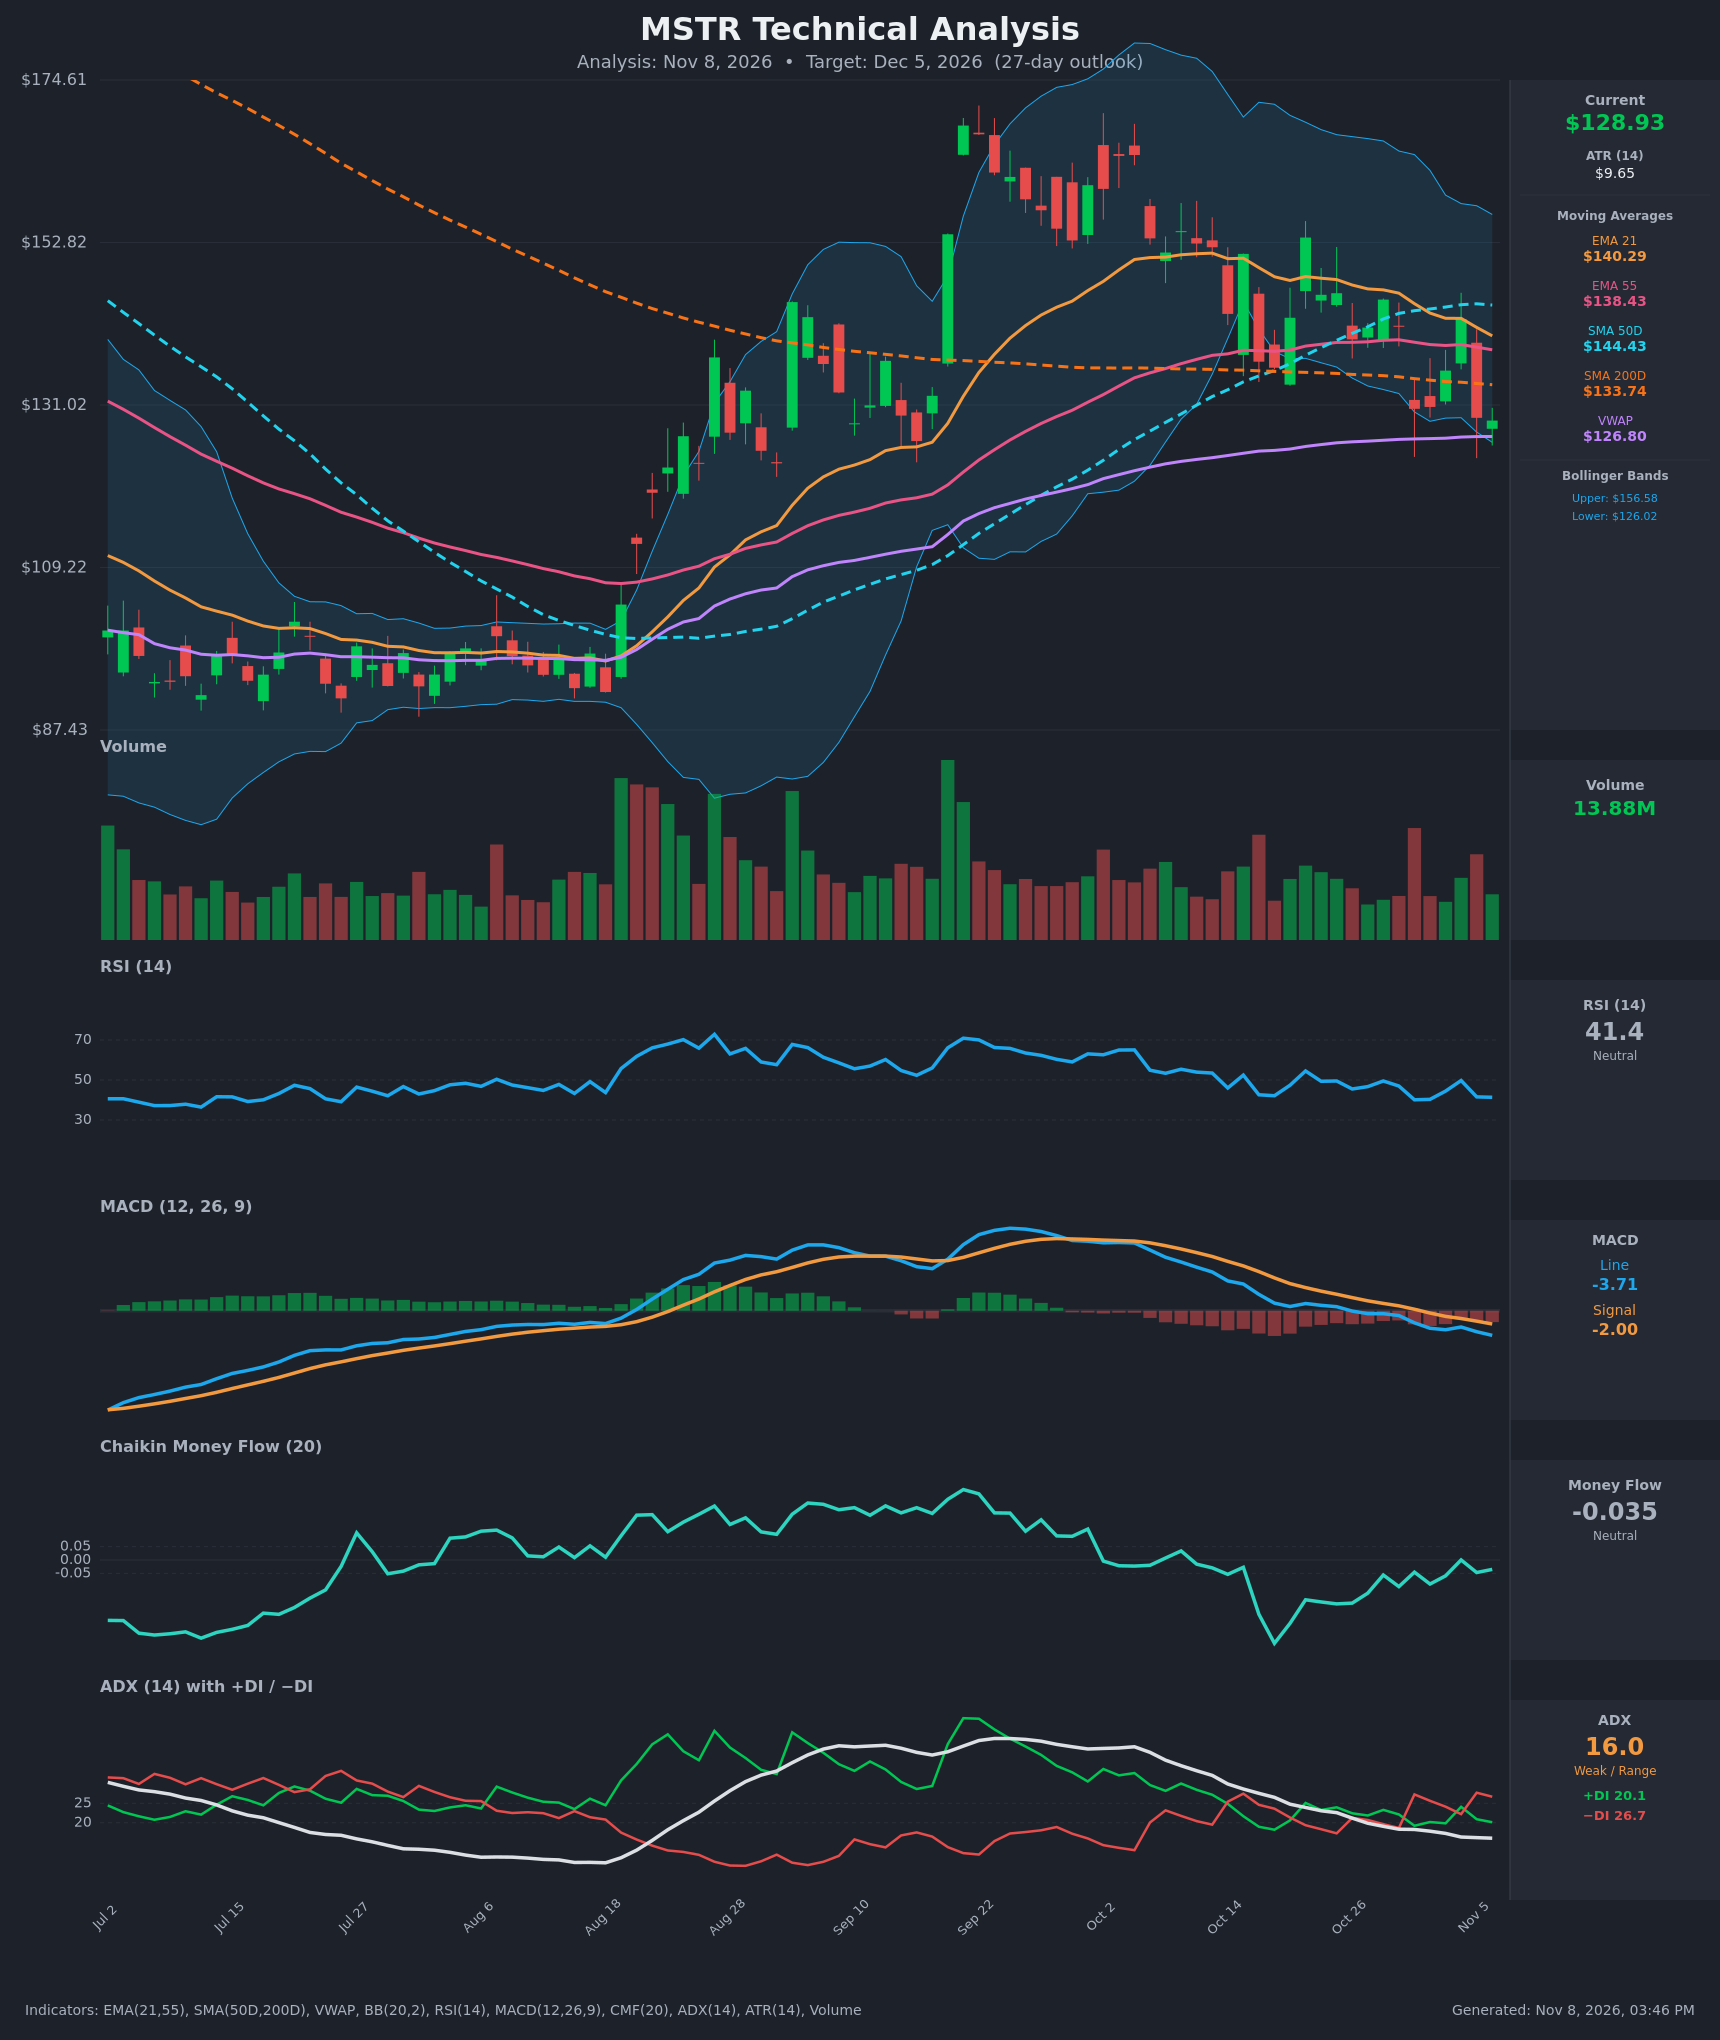
Analysis
TECHNICAL INDICATORS
- RSI (14): 41.35, below the 50 midline but well above oversold (30). It has been capped around 50 on every bounce (49.7 on Nov 4, 54.5 on Oct 21) and keeps making lower highs. Momentum is weak but not exhausted. [Bearish]
- 20 EMA: The data supplies EMA 21 at $140.29. Price at $128.93 is about 8% below it, and the EMA is sloping down (148.2 → 140.3 over 15 bars). It acts as dynamic resistance. The EMA 55 ($138.43) is also overhead, and EMA21 is converging on it. [Bearish]
- MACD: Line -3.71 is below signal -2.00, and the bearish cross happened around Oct 26-30. The histogram is negative and still widening (about -1.7), so downside momentum is still building. [Bearish]
- Bollinger Bands (20): Upper $156.58, lower $126.02. Price is hugging the lower band, about $2.9 above it. The bands are contracting after the September expansion. Riding the lower band is a bearish sign in a downtrend, though it also raises the chance of a mean-reversion bounce toward the $140 midline. [Bearish]
- CMF (20): -0.035, inside the neutral band (±0.05). It has recovered from -0.31 in mid-October, so heavy distribution has eased, but there is no real accumulation either. [Neutral]
- ADX (14): 16.0, which is weak and range-bound, and has been falling from 26.6. −DI (26.7) is above +DI (20.1), and −DI re-took control on Oct 30. This is a weak but bearish-leaning directional bias. [Weak Trend, bearish lean]
- Volume: 13.88M on the latest bar, which is average to below average. The recent red bars (Oct 30, Nov 5) show higher volume than the green bounces, which suggests selling is more convincing than buying. [Mild Bearish]
Other levels:
- SMA200D: $133.74. Price is now below it, losing the long-term trend line.
- SMA50D: $144.43, still above SMA200D, so there is no death cross yet. The gap is narrowing and a death cross is possible in the coming weeks.
- VWAP: $126.80, just below price. It is the nearest support and a key line for buyers.
DIVERGENCES & TRENDS
- There is no clear bullish divergence. RSI (41) and price (near the Oct 30 low of about $130) are moving together. The intraday wicks near $122 on Oct 30 and Nov 5 were bought, but closes keep failing at lower levels.
- The MACD bearish cross, the widening negative histogram and the −DI crossover all agree on the downside.
- The trend structure is lower highs ($170 → $153 → $145 → $142.5) with price now back under all three major moving averages, EMA21, EMA55 and SMA200D.
- EMA21 ($140.29) is closing on EMA55 ($138.43) at about 1.9 points apart. A bearish EMA cross is likely within days.
- CMF improving from -0.31 to -0.035 is the one constructive trend, but it has not turned positive.
- The Nov 4 spike to $142.54 followed by a drop to $129.30 on Nov 5 was a rejection at the EMA21/EMA55 cluster.
CHART PATTERNS
- Descending Triangle (bearish continuation): This is the best fit. There is a series of lower highs from the September peak and horizontal support around $126-$130, where the wicks and closes keep finding buyers. A decisive close below $126 (the lower BB and VWAP) would confirm the break. The measured move is roughly the triangle's height, about $20-$25, which points toward the $105-$110 zone over a longer horizon. For a 27-day window, a partial move to about $120 is more realistic.
- Bearish Lower-High Structure / Head-and-Shoulders-like peak: The Sep 22 peak with lower shoulders is a distribution-style top, and the "neckline" is the $126-$130 support. A break below it would add confirmation.
- Invalidation of the bearish pattern: A reclaim of $140-$144, meaning EMA21 and SMA50D, would turn this into a range or a bullish double-bottom-style recovery.
POTENTIAL SCENARIOS
- Scenario 1: Bearish Breakdown of Support — Price loses the VWAP/lower Bollinger Band area, the MACD and −DI pressure continue, and the descending-triangle break extends lower. Trigger: daily close below $126.00 on rising volume. Target: $120 first, then $112-$115. Invalidation: daily close back above $134 (SMA200D). (55% probability)
- Scenario 2: Bullish Oversold Bounce / Range Recovery — Buyers defend the $122-$126 area and price mean-reverts to the middle of the Bollinger Band and the moving-average cluster. Trigger: bullish reversal candle with rising volume and RSI turning above 50. Target: $138-$141 (EMA55/EMA21). Invalidation: close below $122. (30% probability)
- Scenario 3: Neutral Chop in the $122-$136 Range — Weak ADX (16) keeps price oscillating around the VWAP and SMA200D. Trigger: continued indecision with no close beyond $122 or $136. Target: about $126-$132. Invalidation: a clean break of either boundary on volume. (15% probability)
PRICE TARGETS
For the 27-day horizon (target date Dec 5, 2026), a range of about 15% of price is appropriate. Self-check: $131.00 − $112.00 = $19.00, which is about 14.7% of $128.93, within the 12-18% guidance for 30-60 days and appropriately scaled for 27 days.
- Target Price: $121.00
- Expected Range: $112.00 to $131.00
- Key Levels: Support at $126.00 (lower Bollinger Band / VWAP at $126.80), Resistance at $133.74 (SMA200D)
Secondary levels: support at about $122 (recent wick lows), then $112-$115. Resistance at $138-$140 (EMA55/EMA21), then $144 (SMA50D).
OVERALL BIAS
OVERALL BIAS: BEARISH - Price is below the EMA21, EMA55 and SMA200D, the MACD is below its signal with a widening negative histogram, and −DI leads +DI. The lower-high structure points to a descending-triangle break below the $126 VWAP/lower-band support. Weak ADX and a lower-Bollinger-Band location mean bounces are likely, so conviction is moderate.
This is educational analysis and not financial advice.