NIO 27-day bullish forecast — Nov 8, 2026
- Bias: Bullish
- Timeframe: 27 days (made Nov 8, 2026, target date Dec 4, 2026)
- Price at analysis: $3.39
- Price target: $3.55
- Expected range: $3.10 – $3.65
- Result: Pending — graded after the close on Dec 4, 2026
Get a free AI analysis of NIO today
Analysis
TECHNICAL INDICATORS
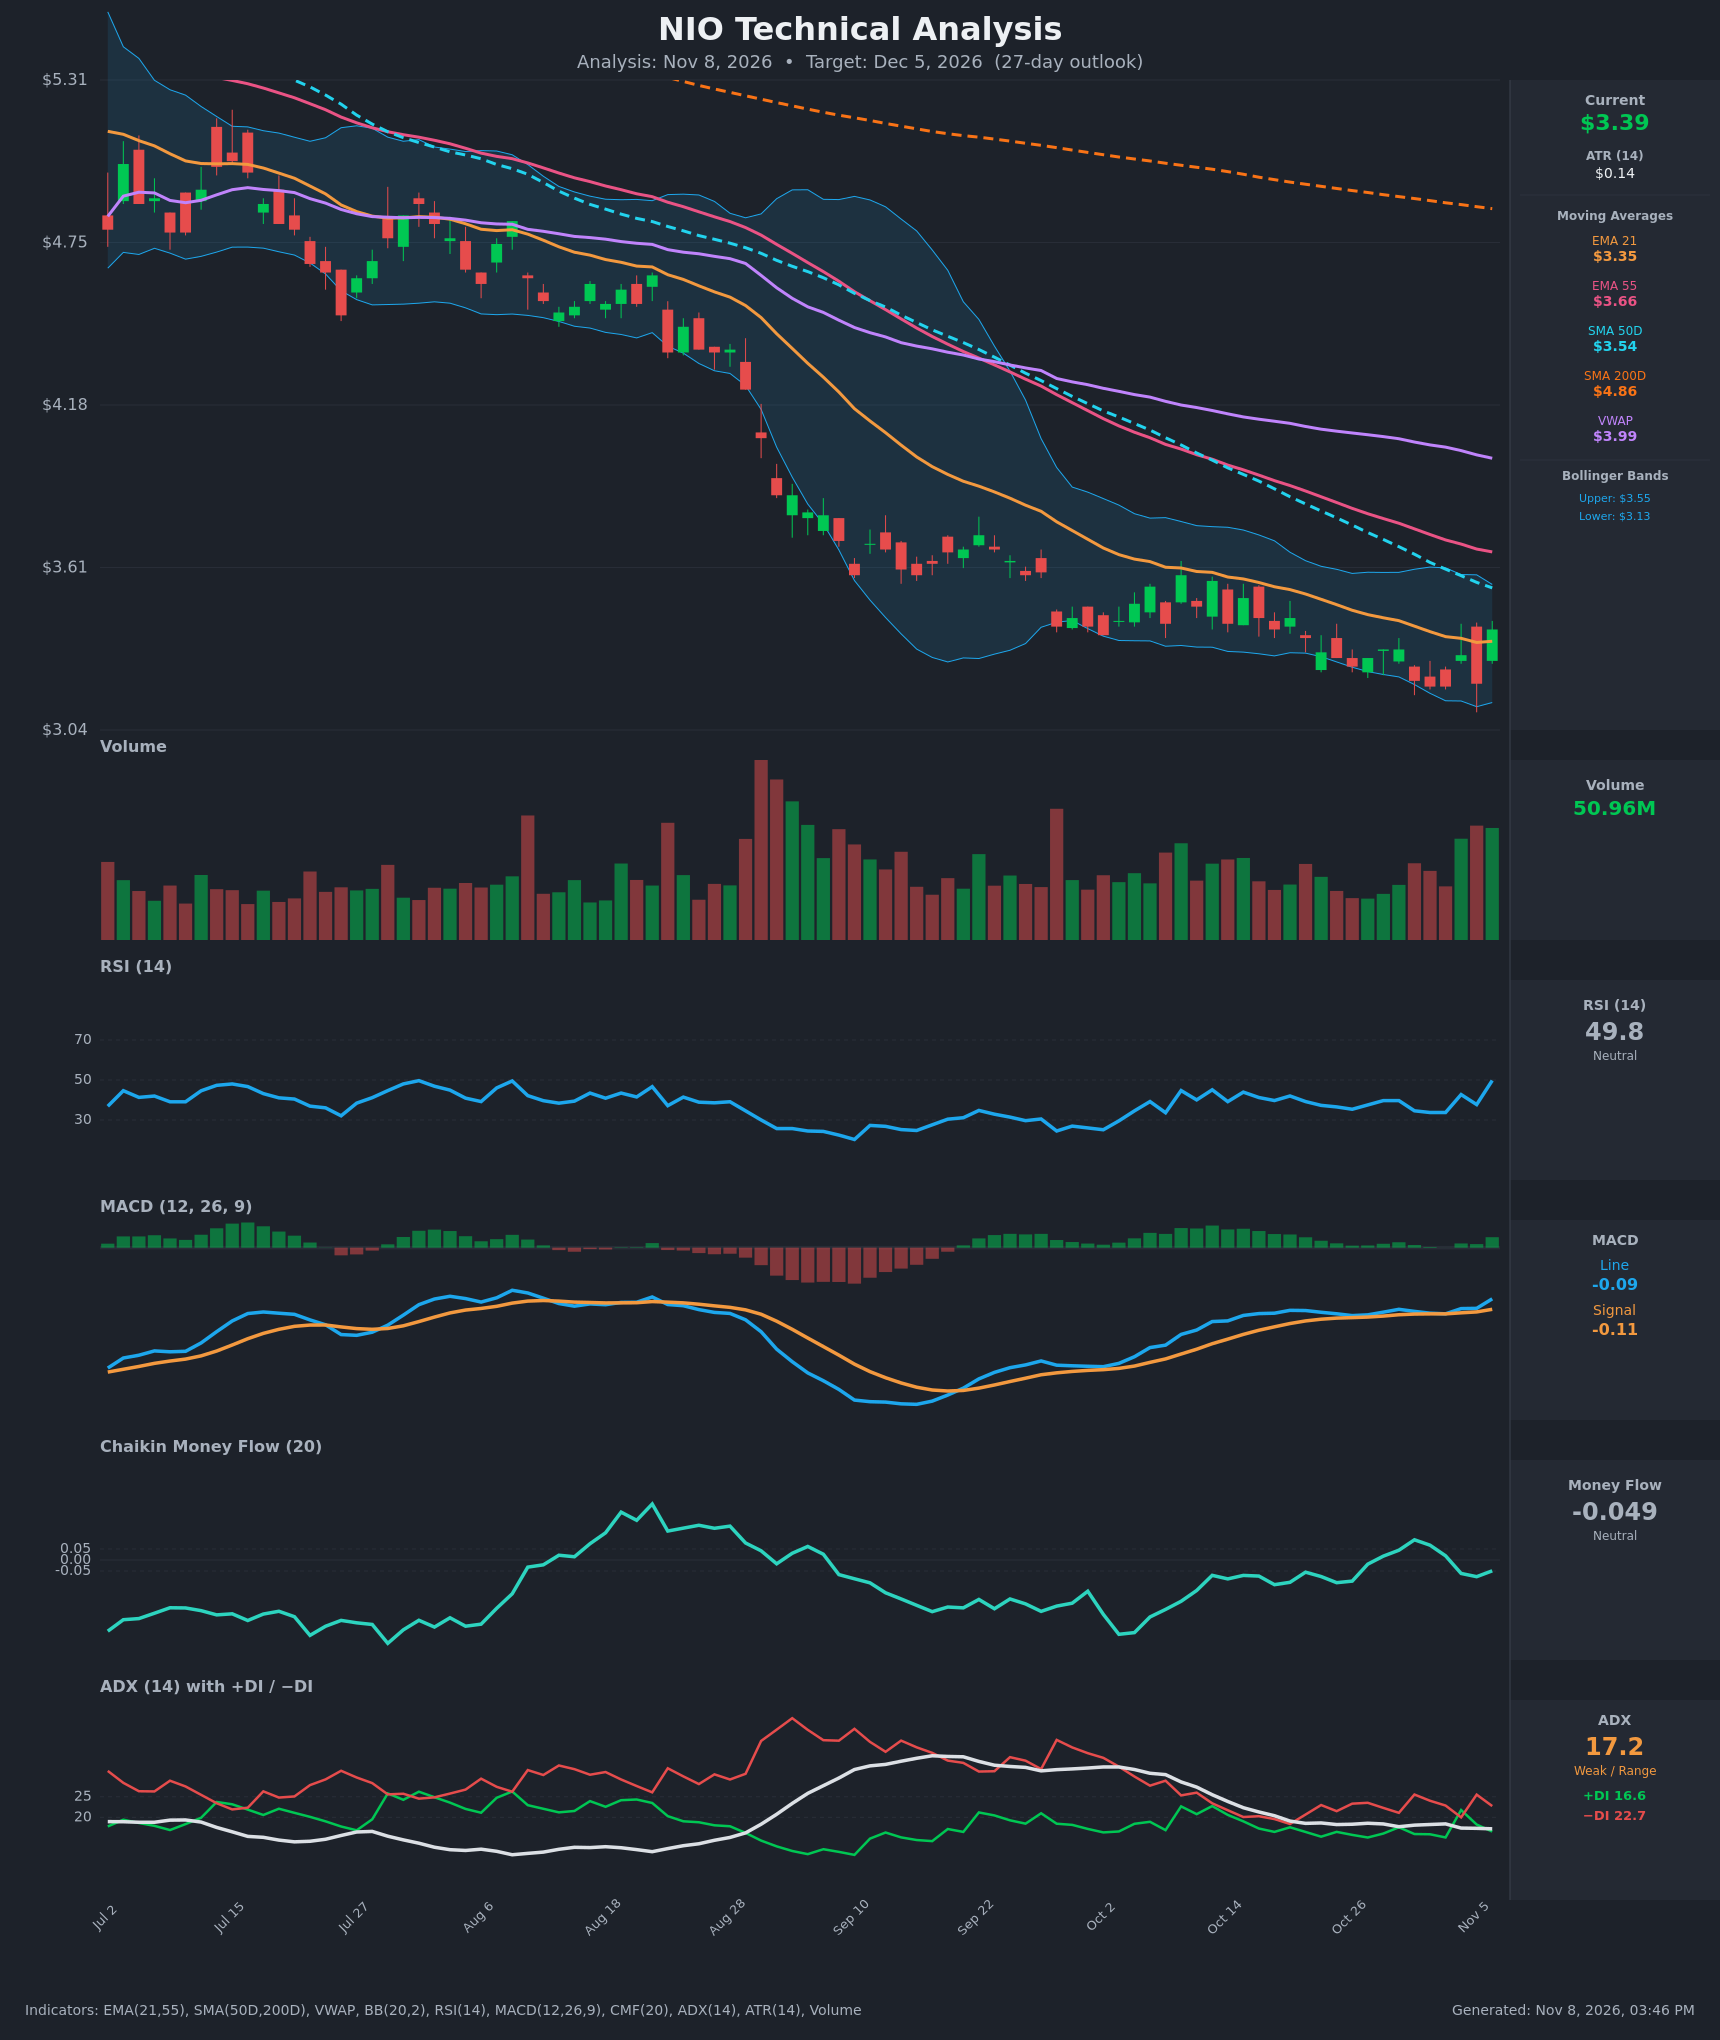
- RSI (14): 49.76, a sharp rebound from 33.7 just three bars ago. It is back at the midline, and its lows (~33-35) sit above the ~25 low of early September while price made lower lows. Momentum is turning up but has not yet been tested at 50-55. [Bullish]
- 20 EMA: The EMA 21 is $3.35 and price at $3.39 is just above it, so it acts as first support after a recapture. EMA 21 is still below EMA 55 ($3.66), a standing bearish stack, and both are sloping down. [Neutral]
- MACD: The line is -0.090, above the signal at -0.108, after a bullish crossover on Nov 4. The histogram is turning positive. The whole indicator is still below zero, so this is a recovery inside a downtrend rather than a confirmed trend change. [Bullish]
- Bollinger Bands (20): Upper $3.55, lower $3.13, with the middle near $3.34. The bands are narrow after price walked the lower band for weeks. The Nov 6 candle bounced off the lower band back to the midline. A squeeze after a long decline often precedes a volatility expansion, and a close above the middle band favors a move toward $3.55. [Bullish]
- CMF (20): -0.049, sitting right at the neutral threshold. It was slightly positive (+0.09) in late October and has faded back to neutral/slightly negative. There is no clear accumulation. [Neutral]
- ADX (14): 17.2 (weak/range-bound), with −DI 22.7 above +DI 16.6, so bears retain a slight edge. The trend is weakening: ADX has fallen from its September peak. The downtrend is losing strength but has not reversed. [Weak Trend, Bearish lean]
- Volume: 50.96M on the Nov 6 green candle, among the highest volumes of the last several weeks. A +5.9% advance on expanding volume suggests real buying interest or short covering at the lows. It needs follow-through to be meaningful. [Bullish]
DIVERGENCES & TRENDS
- Bullish divergence: Price made new lows around $3.10-3.20 in late Oct/early Nov, while RSI (33-35 vs ~25 earlier) and MACD (-0.115 vs about -0.2 earlier) printed higher lows. Selling momentum is fading.
- MACD crossover: The bullish crossover is fresh (Nov 4-6), and the histogram has flipped positive.
- Trend structure: Price is below SMA50 ($3.54), EMA55 ($3.66), VWAP ($3.99) and SMA200 ($4.86). The SMA50 sits well below the SMA200, so the death cross is long established and the long-term trend is down.
- Overhead resistance cluster: The upper Bollinger Band ($3.55), SMA50 ($3.54) and the Sep/Oct breakdown zone make a confluence around $3.54-$3.66.
- ADX: Falling and below 20, so the sell-off is losing trend strength. −DI is still on top, and the +DI/−DI whipsaws show indecision.
CHART PATTERNS
- Bullish Falling Wedge / descending channel (reversal): Since August price has made lower highs and lower lows inside converging bands, with momentum divergence and a volume-backed bounce off the lower boundary. The Bullish Falling Wedge in the reference diagram projects a breakout toward the wedge's upper trendline and the prior reaction zone. The nearest measured target is the SMA50/upper-band area (~$3.55), with an extension toward EMA 55 (~$3.65).
- It is not confirmed until price closes above ~$3.55 on strong volume. The broader backdrop, a large downtrend below the SMA200, means rallies can be sold. Failure back below $3.20 would invalidate the pattern and point to continuation lower.
POTENTIAL SCENARIOS
- Scenario 1: Bullish Reversal Bounce to the SMA50/Upper Band — Divergences and the volume-backed bounce carry price back to the first overhead resistance cluster. Trigger: hold above EMA 21 ($3.35) and close above $3.45 with follow-through volume. Target: $3.54-$3.65. Invalidation: daily close below $3.20. (45% probability)
- Scenario 2: Bearish Failed Bounce and Downtrend Continuation — The rally stalls at the SMA50/EMA55 zone and sellers (−DI on top, bearish MA stack) push price back to the lower band and new lows. Trigger: rejection at $3.54 or a close below $3.30. Target: $3.10-$3.20, then $3.00. Invalidation: a close above $3.66. (38% probability)
- Scenario 3: Neutral Range Chop — Weak ADX keeps price between $3.20 and $3.55 for most of the period. Trigger: low-volume drift around the EMA 21/middle band. Target: $3.30-$3.50. Invalidation: a decisive break of either boundary on volume. (17% probability)
PRICE TARGETS
Timeframe: 27 days (Dec 5, 2026). Range width check: $3.10 to $3.65 is $0.55, or about 16.2% of $3.39, within the 12-18% guidance for 30-60 days and appropriate for 27 days given NIO's volatility (ATR $0.14).
- Target Price: $3.55 (for 27 days)
- Expected Range: $3.10 to $3.65
- Key Levels: Support at $3.20, Resistance at $3.55
OVERALL BIAS
OVERALL BIAS: BULLISH - A fresh MACD bullish crossover, bullish RSI/MACD divergence, a volume-backed bounce off the lower Bollinger Band and a fading ADX favor a recovery toward the $3.55 SMA50/upper-band resistance. Conviction is modest because the long-term trend remains down, with price below the SMA50, EMA55, VWAP and SMA200.
This is educational analysis and not financial advice.