PFE 27-day bearish forecast — Nov 8, 2026
- Bias: Bearish
- Timeframe: 27 days (made Nov 8, 2026, target date Dec 4, 2026)
- Price at analysis: $29.39
- Price target: $28.80
- Expected range: $27.10 – $31.00
- Result: Pending — graded after the close on Dec 4, 2026
Get a free AI analysis of PFE today
Analysis
TECHNICAL INDICATORS
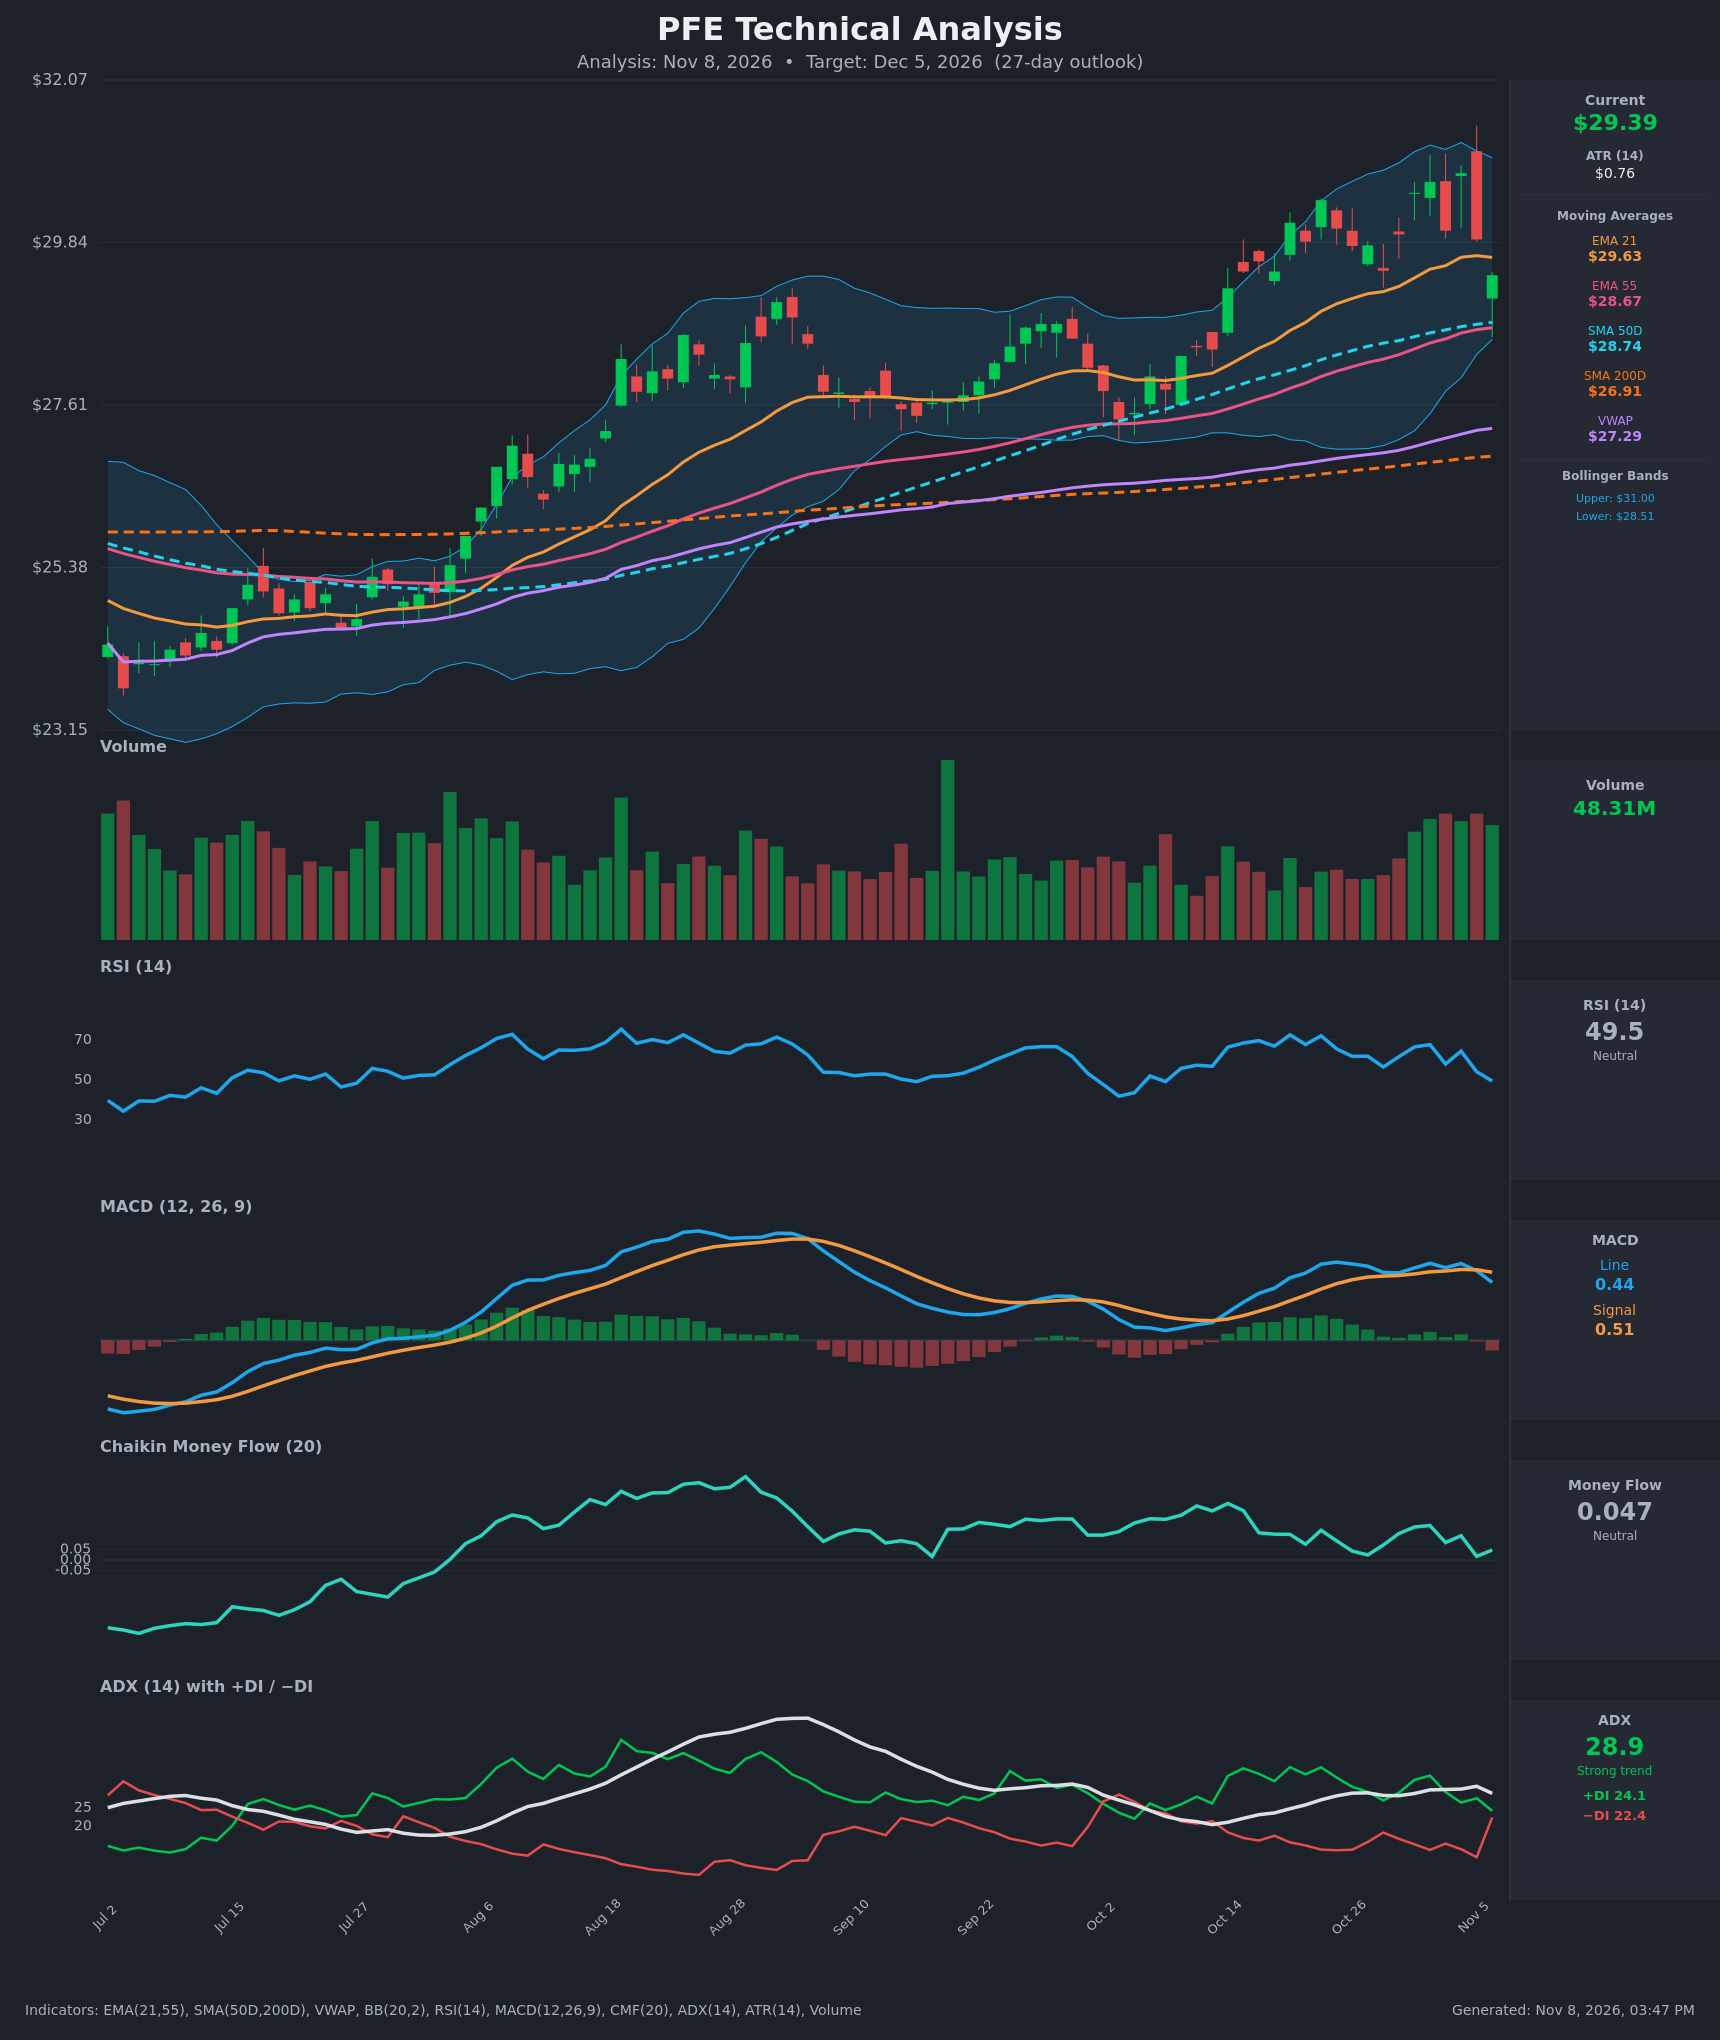
- RSI (14): 49.51, down sharply from 67.7 (Nov 2) and 72.6 (Oct 20). It has lost the 60+ zone and is sitting on the 50 midline. Momentum is fading, but it is not oversold, so there is room to fall further. [Bearish]
- 20 EMA (EMA 21: $29.63): Price at $29.39 closed below the EMA 21 for the first time in several weeks. The EMA 21 is now overhead resistance. EMA 21 remains above EMA 55 ($28.67), so the broader structure is still positive. [Bearish]
- MACD: Line 0.437 crossed below Signal 0.514 on Nov 6, a fresh bearish crossover. The histogram has turned negative (about -0.08). Both lines are still positive, so this is a correction signal rather than a full trend reversal. [Bearish]
- Bollinger Bands (20): Upper $31.00, lower $28.51, midline about $29.75. Price is below the midline in the lower half of the bands. The bands are wide, and repeated failures near the upper band ($30.5-$30.8) suggest the move is exhausted. A walk back toward the lower band near $28.5 is the natural path. [Bearish]
- CMF (20): 0.047, just under the +0.05 accumulation threshold and down from 0.164 (Nov 2). Buying pressure is fading but has not turned into distribution. [Neutral]
- ADX (14): 28.9, so the trend is strong. +DI 24.1 vs −DI 22.4 puts the bulls only narrowly on top. +DI has collapsed from 36 and −DI has jumped from 11.6 to 22.4 in one session. A bearish DI crossover is imminent. [Strong Trend, but direction weakening: bullish edge shrinking]
- Volume: 48.31M, elevated versus the prior weeks, with the recent heavy bars on down days (red bars Nov 4-6). Heavy volume on the decline points to distribution near $30.5-$30.8. [Bearish]
DIVERGENCES & TRENDS
- Price held near the $29.4-$30.8 area while RSI fell from 72 to 49.5. The higher-high attempt at $30.79 on Nov 4 had weaker momentum than the Oct 22 push, which is a mild bearish divergence.
- MACD peaked at 0.591 (Oct 23) and failed to make a new high at 0.582 (Nov 2), then crossed down.
- CMF is trending down from 0.164 to 0.047, and ADX is trending sideways to up while the DIs converge.
- Moving averages are still stacked bullishly: price > EMA 55 > SMA 50 > SMA 200, and SMA 50 ($28.74) is far above SMA 200 ($26.91). The long-term uptrend is intact, but price is now below the fast EMA.
- Price is well above VWAP ($27.29), so the market is extended relative to the anchored average.
CHART PATTERNS
- Bearish Triple Top / Double Top (loose): Highs at $30.52 (Oct 30), $30.67 (Nov 2) and $30.79 (Nov 4) form a resistance zone around $30.5-$30.8. The "neckline" is the $29.4-$29.5 area (Oct 28 low of $29.45, and today's $29.39 close). A decisive close below this level projects a measured move of roughly the pattern height ($30.8 - $29.4 = $1.4), so about $28.0. The first realistic support on the way is $28.7, where EMA 55 and SMA 50 converge.
- The pullback may also be a Bullish Flag / consolidation inside the larger uptrend from $24-$25 in July. That is the main counter-scenario if $28.7 holds.
POTENTIAL SCENARIOS
- Scenario 1: Bearish Pullback to the EMA 55 / SMA 50 Zone — The bearish MACD cross, loss of the EMA 21, DI convergence and the triple-top rejection suggest a test of the rising moving-average cluster. Trigger: daily close below $29.40 (neckline) with continued heavy volume. Target: $28.70, with an extension to $28.00 if the cluster breaks. Invalidation: reclaim of $29.85 and the EMA 21 on a closing basis. (45% probability)
- Scenario 2: Bullish Trend Resumption — Price holds the $28.7-$29.4 support, the MACD re-crosses up, and the stock retests and breaks the $30.8 highs. This would be a flag-like continuation of the uptrend. Trigger: close above $30.00 followed by a break of $30.80. Target: $31.50-$32.00. Invalidation: close below $28.60. (35% probability)
- Scenario 3: Neutral Range Consolidation — Price chops between $28.7 and $30.5 as ADX cools. Trigger: failure to break either side for several weeks. Target: about $29.40. Invalidation: close outside the $28.50-$30.80 range. (20% probability)
PRICE TARGETS
- Target Price: $28.80 (27-day horizon)
- Expected Range: $27.10 to $31.00. Width is $3.90, about 13.3% of the current price, which fits the 12-18% guidance for a 30-60 day window and is appropriately wider than short-term ranges.
- Key Levels: Support at $28.70 (EMA 55 / SMA 50 confluence), Resistance at $30.80 (triple-top highs)
OVERALL BIAS
OVERALL BIAS: BEARISH - The fresh MACD bearish crossover, loss of the EMA 21, RSI dropping to 49.5, heavy-volume red days and a triple-top rejection at $30.5-$30.8 point to a pullback toward the $28.70 EMA 55 / SMA 50 cluster. The longer-term uptrend remains intact, so the decline is likely a correction rather than a full reversal, and conviction is modest.
This is educational analysis and not financial advice.