SLV 27-day bearish forecast — Nov 8, 2026
- Bias: Bearish
- Timeframe: 27 days (made Nov 8, 2026, target date Dec 4, 2026)
- Price at analysis: $46.87
- Price target: $45.50
- Expected range: $42.40 – $48.60
- Result: Pending — graded after the close on Dec 4, 2026
Get a free AI analysis of SLV today
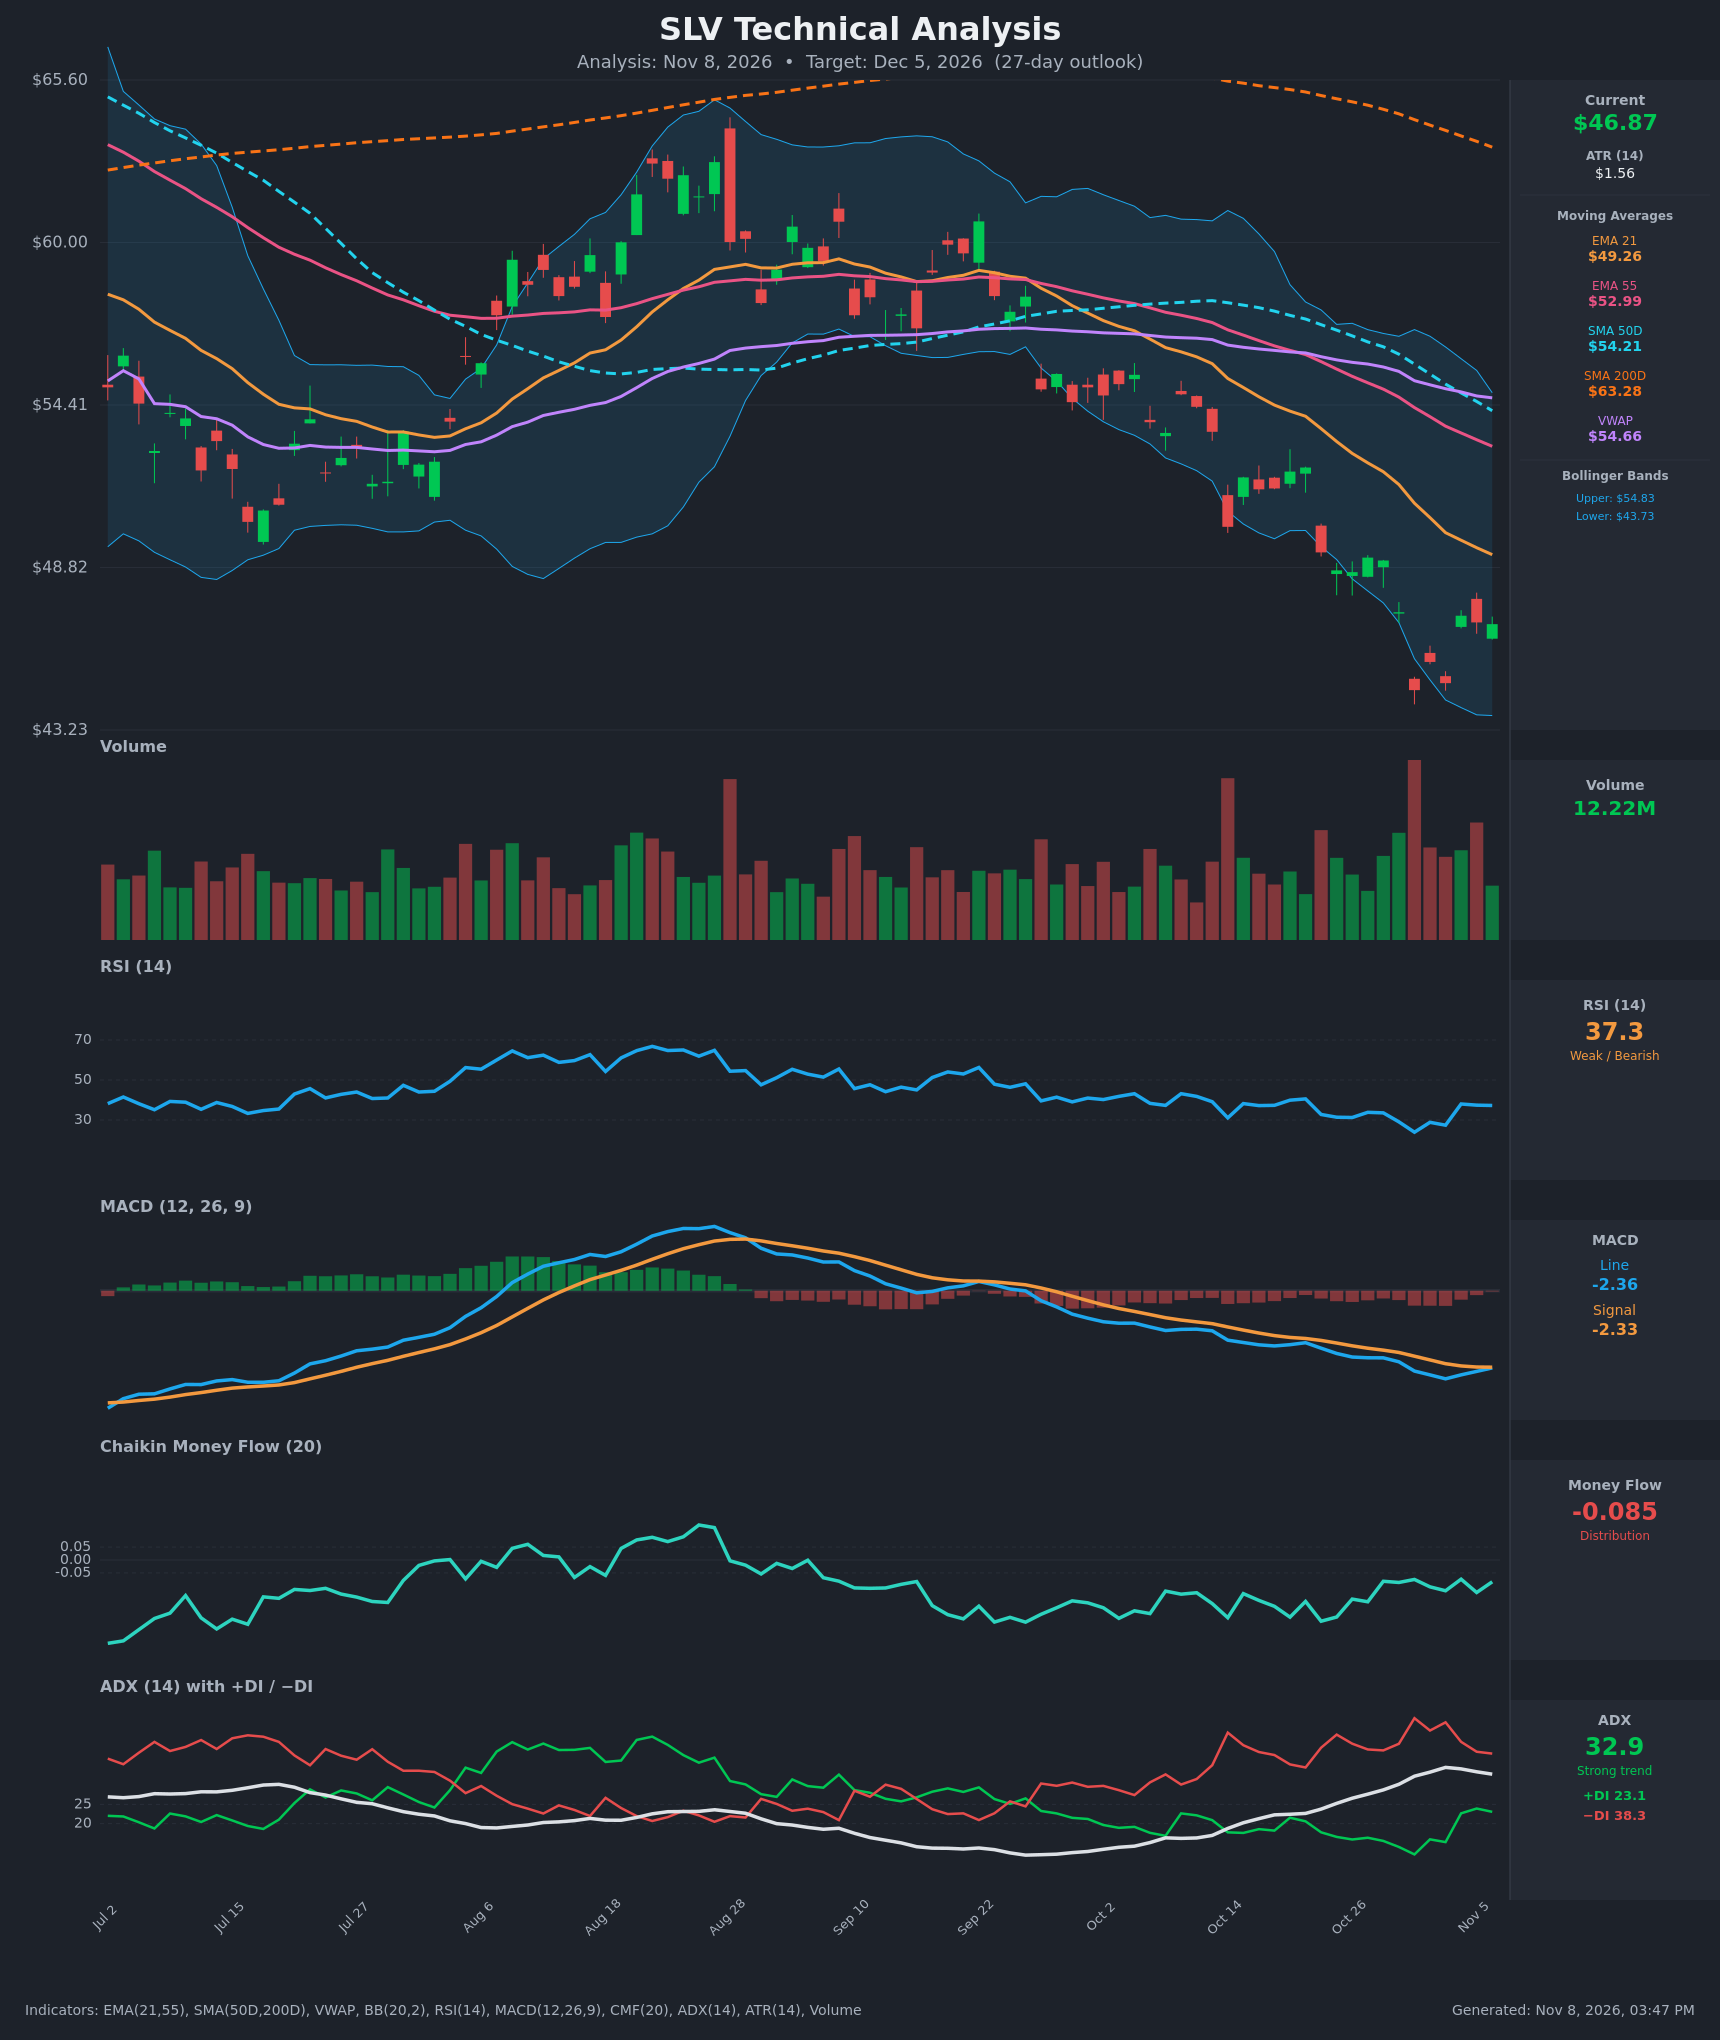
Analysis
TECHNICAL INDICATORS
- RSI (14): 37.26. It rebounded from a deeply oversold 23.9 (Oct 30) but has stalled in the 37-38 area after the Nov 4 spike, which is a weak, bearish-zone reading. The oversold bounce is losing steam below 40-45, where RSI resistance normally sits in downtrends. [Bearish]
- 20 EMA (EMA 21 = $49.26): Price ($46.87) is about 4.9% below it, and the EMA keeps sloping down (54.41 → 49.26 in 15 bars). EMA21 is also below EMA55 ($52.99), so the short-term structure is bearish. The 21 EMA is overhead resistance, with the first test near $49. [Bearish]
- MACD: Line -2.355 vs signal -2.334, histogram about -0.02. Both lines are well below zero. The histogram has narrowed sharply from about -0.46 on Nov 3, so a bullish crossover is imminent. A cross this far below the zero line is usually only a relief signal, not a trend change. [Neutral]
- Bollinger Bands (20): Upper $54.83, lower $43.73, midline about $49.28. Price walked the lower band into Oct 30 (low $44.60 near the $43.73 band), bounced, and now sits in the lower third of the bands. The wide bands show elevated volatility. Price remains well below the midline, so the downtrend is intact, though the band touch makes a mean-reversion bounce toward $49 plausible. [Bearish]
- CMF (20): -0.085, below the -0.05 threshold and negative throughout the entire decline. It has improved slightly from -0.24 but never turned positive during the bounce. This is persistent distribution. [Distribution]
- ADX (14): 32.9 with −DI (38.3) well above +DI (23.1). ADX is above 25 and rising from the lows, though it has slipped slightly from the 34.7 peak. This is a strong downtrend with bears in control. +DI has recovered from 11.9 but remains far below −DI. [Strong Trend – Bearish]
- Volume: 12.22M, near recent averages. The largest volume spikes came on the red sell-off days (Oct 22 area and Oct 30). The bounce candles on Nov 2-6 show only moderate volume, so there is no sign of capitulation buying. [Bearish – selling volume dominant, weak bounce participation]
DIVERGENCES & TRENDS
- Bullish momentum divergence (minor): RSI made a deep low of 23.9 on Oct 30, but the retest low on Nov 3 (price $44.84) produced a higher RSI of 27.4, and the MACD histogram has been shrinking since. This is an early sign of selling exhaustion.
- No trend-confirming reversal yet: RSI remains below 40, CMF is negative, and −DI is far above +DI. The divergences support a bounce, not a reversal.
- Moving average structure: Price is below EMA21 ($49.26), EMA55 ($52.99), SMA50 ($54.22), SMA200 ($63.28), and VWAP ($54.66). EMA21 is below EMA55, and SMA50 is far below SMA200, so the death cross is long established. Price is below SMA200, which marks a long-term downtrend.
- MACD is about to cross up, but below zero. The DI lines are not close to crossing (a gap of 15 points).
- Price structure: Lower highs and lower lows since the late-September peak, with a failed bounce at $52.26 (Oct 21). Support is $44.60-44.84 (two lows within about $0.25 of each other), and the bounce high is $47.16-47.28.
CHART PATTERNS
- Bearish Flag / Descending channel (continuation): The sharp fall from about $52 to $44.60 followed by a tight, low-conviction bounce fits a bearish flag or pennant. A breakdown below $44.60 projects roughly $41-42 (flagpole of about $7-8 measured from the break). This is the primary pattern.
- Possible Bullish Double Bottom (reversal): Lows at $44.60 (Oct 30) and $44.84 (Nov 3), with a neckline near $47.2-47.8 (Oct 29 / Nov 4 highs). Price is sitting right at the neckline. A confirmed close above $47.8 would project a measured move of about $3 to $50.5, in line with EMA21 resistance at $49.26. It is not confirmed, and the rising bounce volume needed to validate it is lacking.
- Since the dominant trend is down and ADX is strong, continuation takes priority over reversal.
POTENTIAL SCENARIOS
- Scenario 1: Bearish Continuation / Flag Breakdown — Price fails at the $47.2-47.8 neckline area and the downtrend resumes, with −DI dominance and distribution (CMF) persisting. Trigger: daily close below $44.60-44.80 on rising volume. Target: $42.50-43.70 (lower Bollinger area and flag projection), with a drift toward $45.50 as the central expectation. Invalidation: daily close above $49.30 (EMA21). (50% probability)
- Scenario 2: Bullish Oversold Relief Rally / Double Bottom — The MACD crossover and RSI divergence trigger a counter-trend bounce toward the declining EMA21 and the Bollinger midline. Trigger: close above $47.80 with RSI above 45. Target: $49.00-49.30, with an extension to $50.50 (double-bottom measured move). Invalidation: close below $44.60. (35% probability)
- Scenario 3: Neutral Range Consolidation — Price chops between $44.60 and $48 as volatility compresses and ADX fades. Trigger: no close beyond either boundary. Target: $45.50-47.50. Invalidation: close outside the $44.40-48.20 range. (15% probability)
PRICE TARGETS
- Target Price: $45.50 (27-day, Dec 5, 2026)
- Expected Range: $42.40 to $48.60 (width $6.20, about 13.2% of the current price, which fits the 27-day timeframe guidance of roughly 12-18% and is well above the 2-3 day and 14-day ranges)
- Key Levels: Support at $44.60, Resistance at $49.26
OVERALL BIAS
OVERALL BIAS: BEARISH - The strong downtrend (ADX 32.9, −DI 38.3 vs +DI 23.1), price below every moving average including a long-established death cross, persistent distribution (CMF -0.085) and weak RSI favor continuation lower. Conviction is modest because the oversold bounce, RSI divergence and imminent MACD cross make a relief rally to about $49 a real risk.
This is educational analysis and not financial advice.