ARM 34-day bearish forecast — Nov 8, 2026
- Bias: Bearish
- Timeframe: 34 days (made Nov 8, 2026, target date Dec 11, 2026)
- Price at analysis: $174.62
- Price target: $164.00
- Expected range: $149.00 – $178.00
- Result: Pending — graded after the close on Dec 11, 2026
Get a free AI analysis of ARM today
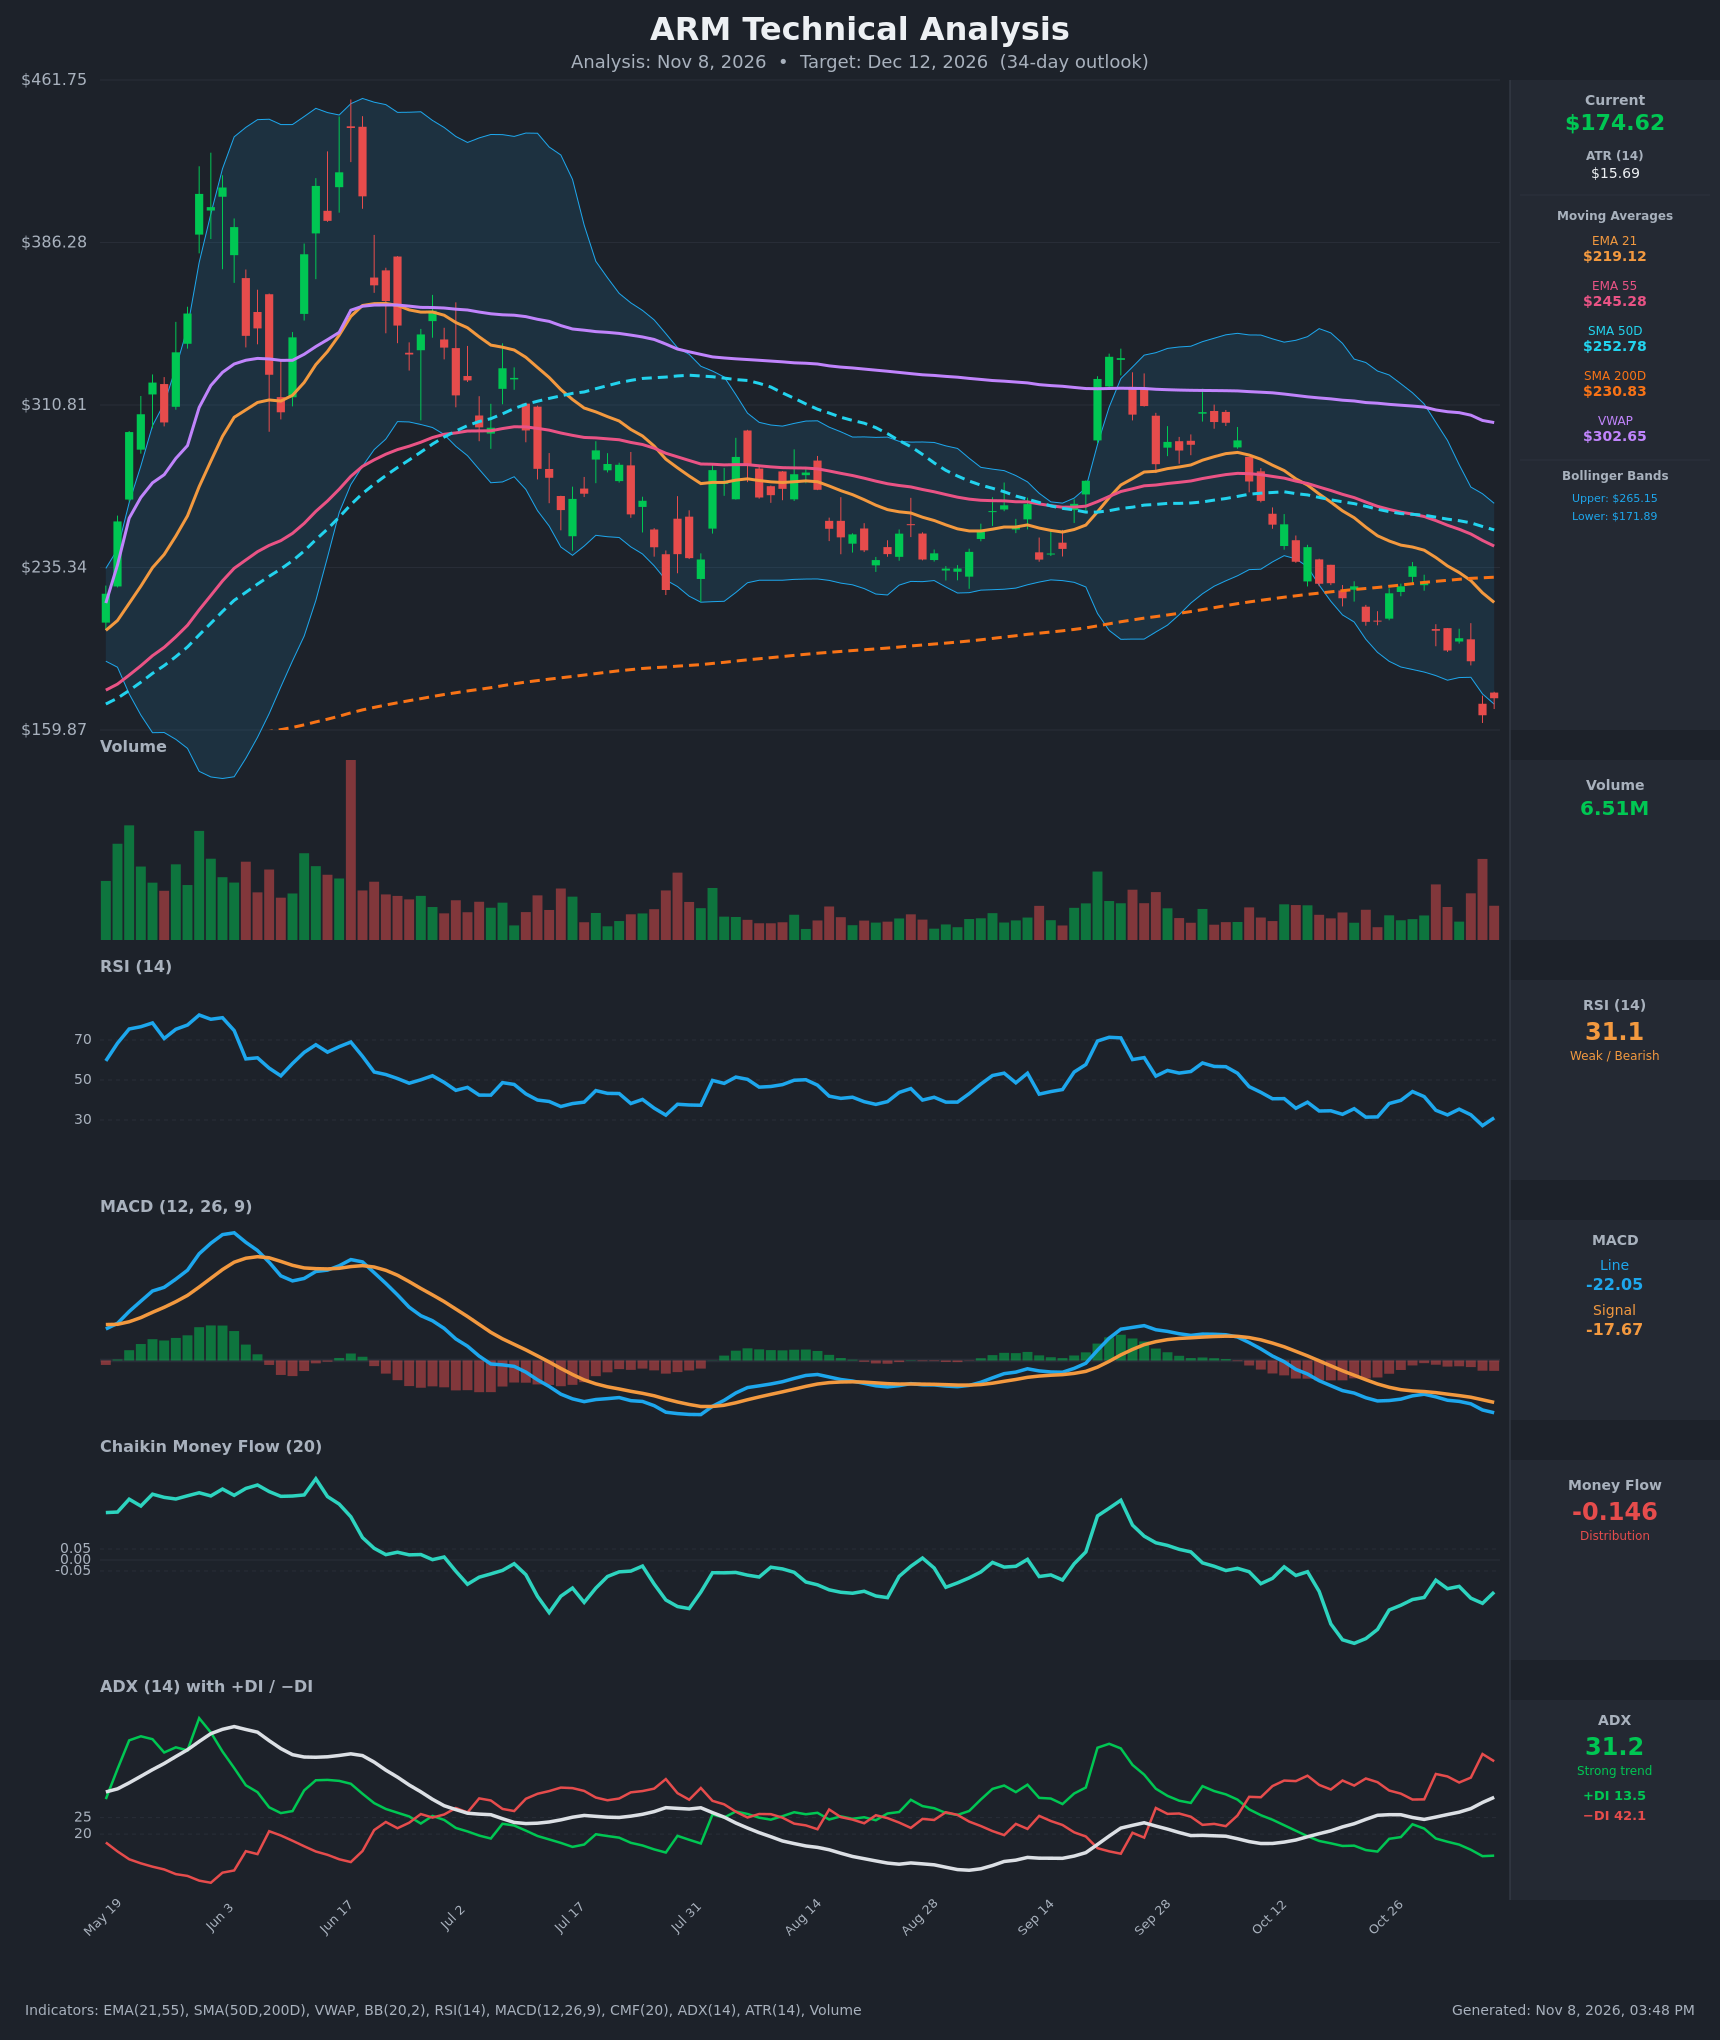
Analysis
TECHNICAL INDICATORS
- RSI (14): 31.08, bouncing off 27.2 on Nov 5 but still near oversold and below 50. RSI has stayed in a 27-45 band for weeks with no move back above 50, so momentum remains weak. [Bearish]
- 20 EMA (EMA 21 = $219.12): Price at $174.62 is about 20% below the EMA, which is falling steeply and acting as overhead resistance. EMA21 is also well below EMA55 ($245.28), a bearish alignment. [Bearish]
- MACD: Line -22.05 is below the signal at -17.67, and both are below zero. The gap widened from -2.2 on Oct 19 to -4.4 now, so the histogram is expanding negatively and the line is making new lows. [Bearish]
- Bollinger Bands (20): Price is hugging the lower band ($171.89), with the upper band at $265.15. The bands are wide, which signals high volatility. The lower-band ride shows a strong downtrend, but it also raises the odds of a short-term snap-back. [Bearish]
- CMF (20): -0.146, well below -0.05. It has been negative for most of the decline and has not turned up convincingly, so sellers still dominate. [Distribution]
- ADX (14): 31.2 and rising (from 21.0 on Oct 19). −DI at 42.1 is far above +DI at 13.5, so the trend is strong and bears are firmly in control. [Strong Trend – Bearish]
- Volume: 6.51M, with the Nov 5 selloff on heavy volume. The recent red bars are large relative to the quiet September-October stretch, which shows real distribution. The heavy volume could also mark a capitulation flush. [Bearish with capitulation risk]
DIVERGENCES & TRENDS
- Death cross setup: SMA50D ($252.78) is still above SMA200D ($230.83), but the gap is narrowing and the 50D is rolling over. A death cross is likely within weeks if price does not recover. Price is now far below the SMA200D, so the long-term trend is down.
- EMA structure: EMA21 is below EMA55 and both are below SMA50D, a fully bearish stack. Price is also far below VWAP ($302.65), which means distribution.
- MACD: The line is making new lows with no bullish crossover in sight.
- Mild RSI divergence: RSI is at 31.1 now versus 31.4-31.5 on Oct 22-23, when price was around $210. Price fell about 17% while RSI held flat, which hints at fading downside momentum. It is only a hint, because RSI has not made a higher low and there is no confirmation.
- ADX/DI: −DI has been above +DI since early October and the gap is widening. This confirms a persistent downtrend.
- Break of the range: Price broke below the $225-$235 consolidation floor (Aug-Oct) and below the SMA200D, with a gap-style leg lower on Nov 5.
CHART PATTERNS
- Bearish range/triple-top style breakdown: From July to October price chopped between roughly $235 and $300, then lost the support floor near $225-$235. The measured move (range height about $65) projects to roughly $165-$170, which price has nearly reached.
- Larger distribution structure: The June peak near $440 followed by the lower high around $330 in September resembles a broad head-and-shoulders-style top. The prior support near $235 now acts as resistance.
- No bullish reversal pattern yet: There is no confirmed double bottom or falling wedge. Price must reclaim at least $190-$200 to start building one.
- Target significance: The pattern target is largely achieved, so downside beyond about $160 would need fresh selling. That favors a modest downside target over a collapse.
POTENTIAL SCENARIOS
- Scenario 1: Bearish Trend Continuation — Price stays below all moving averages, bounces weakly, and then grinds lower as −DI dominance and distribution persist. Trigger: close below $166.72 (Nov 5 close) and the $160 area. Target: $155-$165. Invalidation: daily close above $192. (50% probability)
- Scenario 2: Bullish Oversold Relief Bounce — RSI near 30, price at the lower Bollinger Band, and heavy capitulation volume set up a mean-reversion bounce toward the falling EMA21. Trigger: close above $192 with MACD histogram contracting. Target: $200-$219 (EMA21 resistance). Invalidation: break back below $166. (35% probability)
- Scenario 3: Neutral Basing Range — Price stabilizes after the flush and chops between support and resistance as volatility compresses. Trigger: holds $160-$166 with ADX turning down. Target: $165-$185. Invalidation: close outside $160-$192. (15% probability)
PRICE TARGETS
Range width check: $178.00 − $149.00 = $29.00, which is 16.6% of $174.62. This fits the 30-60 day guidance of 12-18%.
- Target Price: $164.00 (34-day)
- Expected Range: $149.00 to $178.00
- Key Levels: Support at $160.00, Resistance at $192.00
OVERALL BIAS
OVERALL BIAS: BEARISH - Price sits below every moving average with −DI (42.1) far above +DI (13.5), ADX at 31 and rising, a widening MACD gap below zero, and CMF showing distribution. The oversold RSI and lower-Bollinger-Band position make a relief bounce likely along the way, but the weight of evidence favors lower prices over 34 days.
This is educational analysis and not financial advice.