EEM 34-day bearish forecast — Nov 8, 2026
- Bias: Bearish
- Timeframe: 34 days (made Nov 8, 2026, target date Dec 11, 2026)
- Price at analysis: $59.33
- Price target: $57.60
- Expected range: $53.50 – $62.30
- Result: Pending — graded after the close on Dec 11, 2026
Get a free AI analysis of EEM today
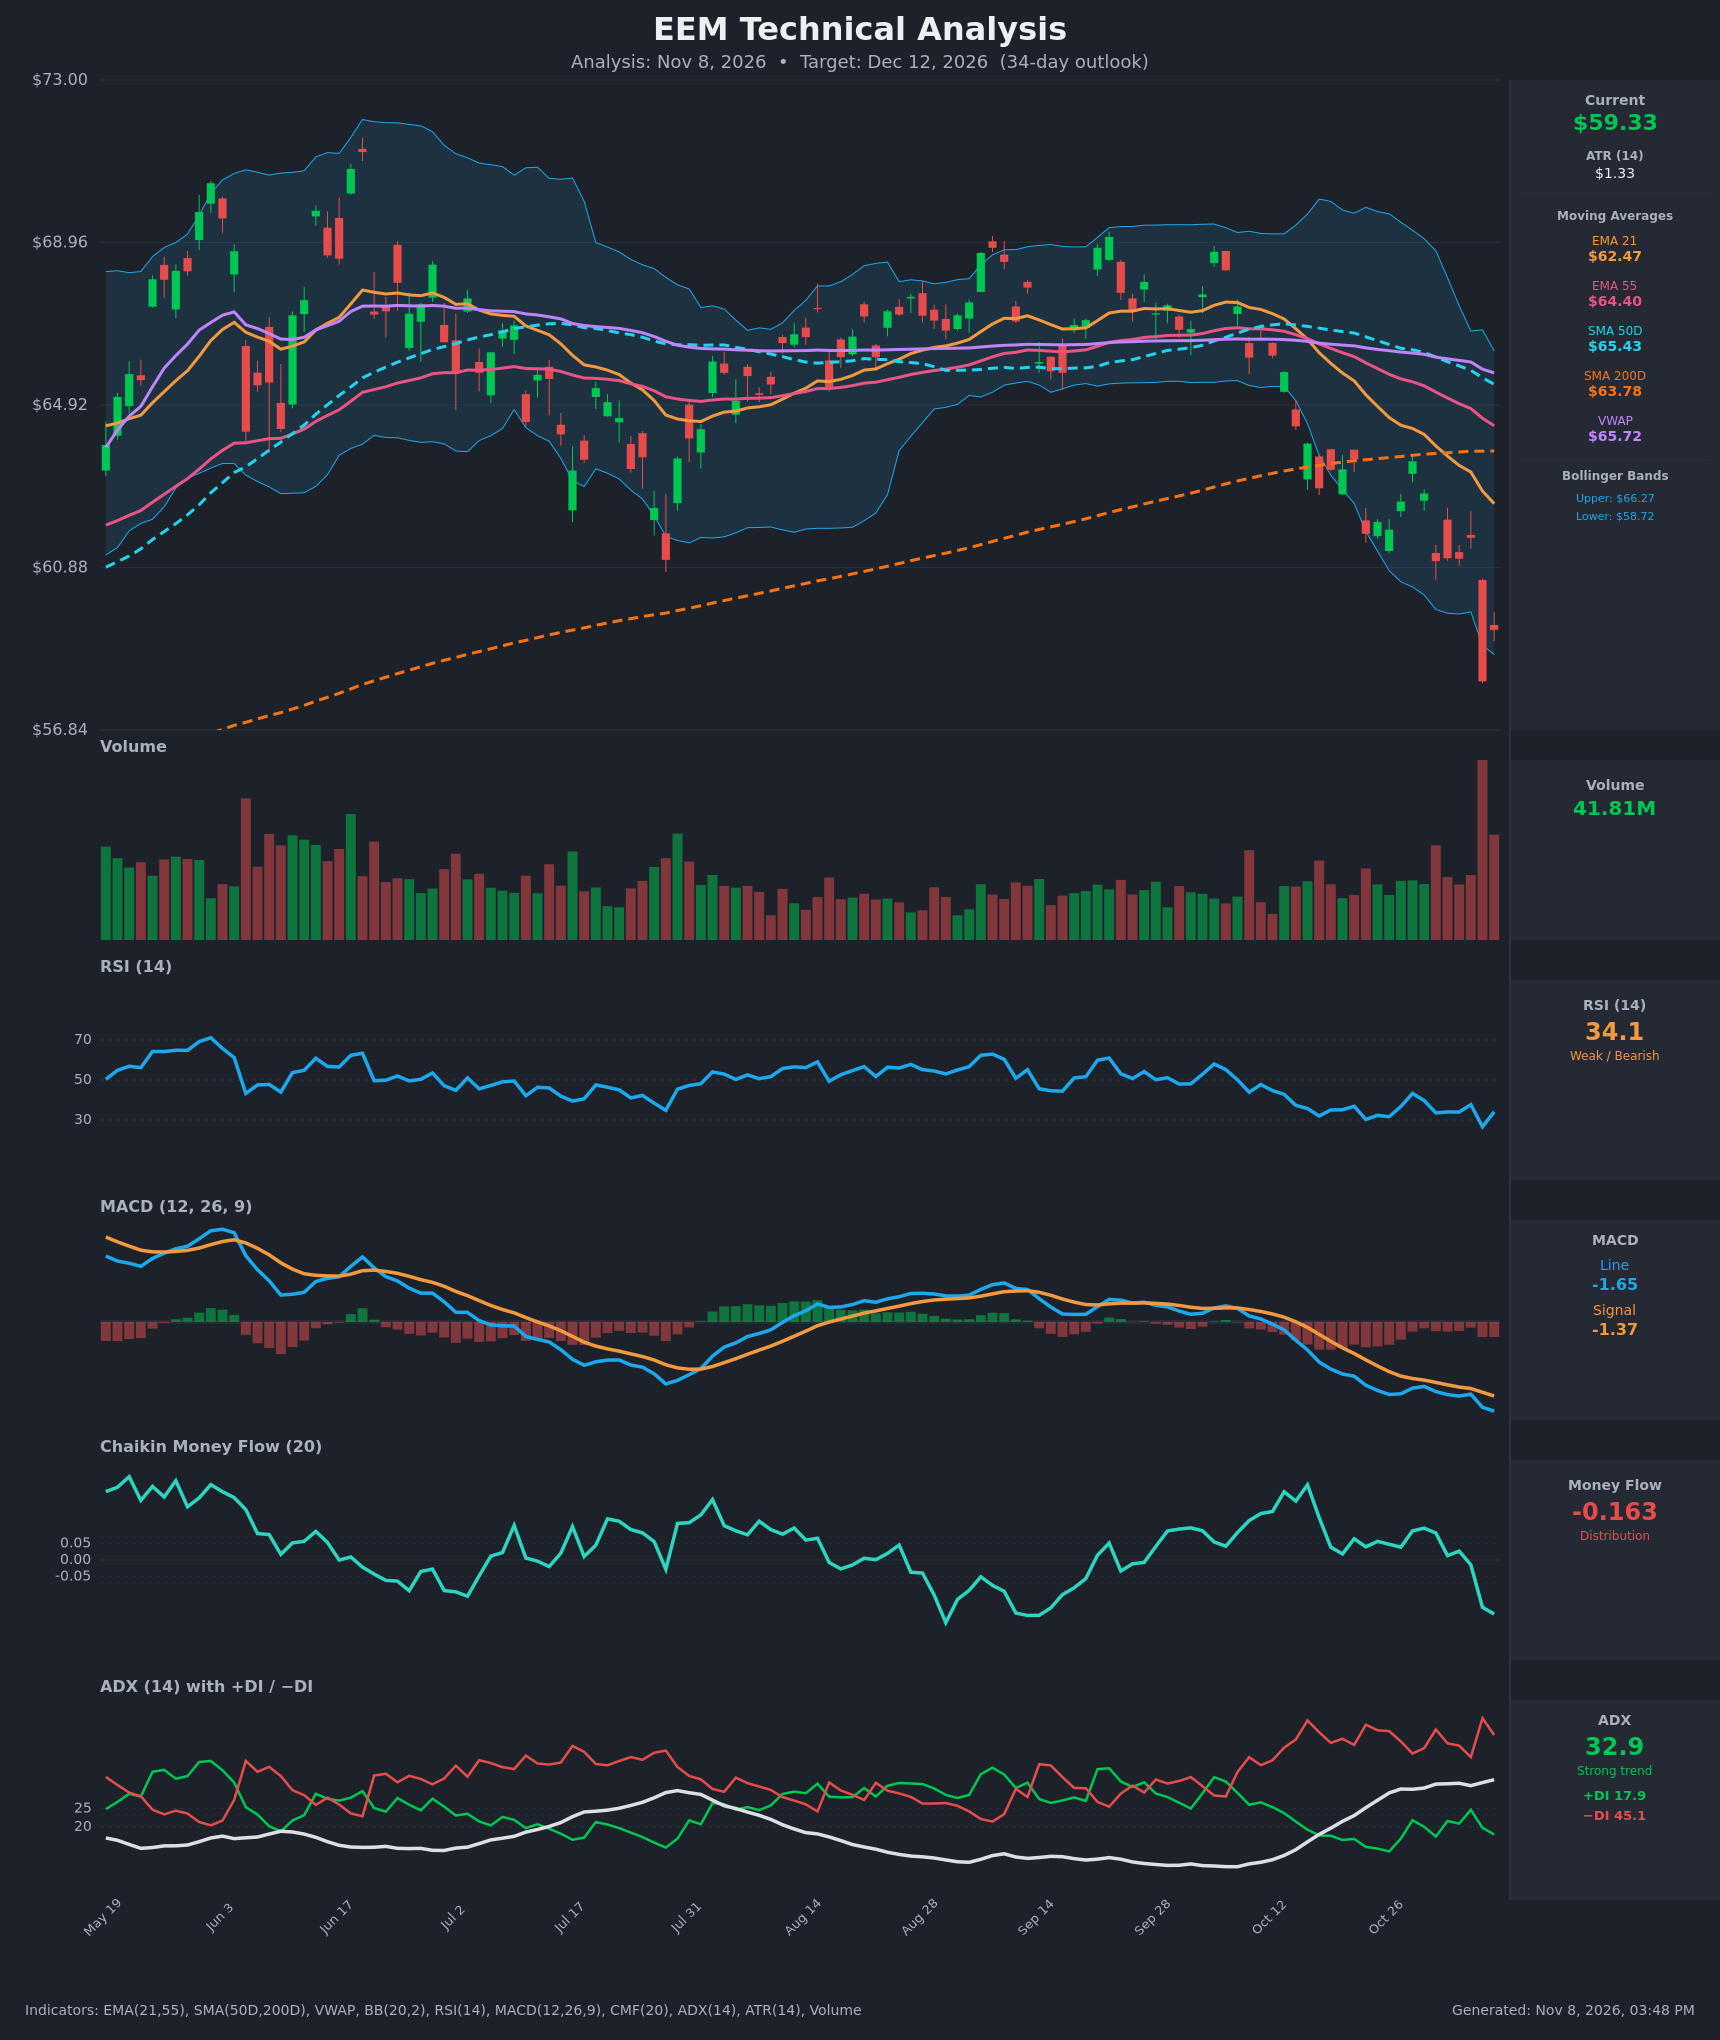
Analysis
TECHNICAL INDICATORS
- RSI (14): 34.10, bouncing off a 26.6 reading on Nov 5 that was clearly oversold. It is still below 40 and has failed to reclaim 50 since early October. Momentum is weak, with only a minor oversold bounce. [Bearish]
- 20 EMA (EMA 21): $62.47, with price at $59.33 about 5% below it. The EMA is falling steeply, from $65.96 on Oct 19 to $62.47. It acts as overhead resistance. EMA 21 is also well below EMA 55 ($64.40), a bearish alignment. [Bearish]
- MACD: Line -1.646 is below Signal -1.368, and the histogram is negative at about -0.28 and widening. Both lines are falling below zero. Lines have been in a bearish cross since mid-October, and the gap has widened again over the last 3 bars. [Bearish]
- Bollinger Bands (20): Upper $66.27, lower $58.72. Price at $59.33 sits in the lower 5% of the band, just above the lower band, after a Nov 5 piercing of the lower band. The bands have expanded sharply downward. In a strong trend, walking the lower band is a continuation sign more than a reversal signal. [Bearish]
- CMF (20): -0.163, down from about +0.09 on Oct 29 and now deep in distribution (below -0.05). It has dropped quickly in the last 3 bars, which shows heavy selling pressure. [Distribution]
- ADX (14): 32.9 and rising (19.7 → 32.9 in 15 bars), with −DI at 45.1 far above +DI at 17.9. This is a strong, established downtrend with bears firmly in control. [Strong Trend – Bearish]
- Volume: 41.81M on the latest bar, the largest of the whole chart, which was the Nov 5 breakdown candle's heavy volume followed by elevated volume on the bounce. The volume spike on a break below the SMA200D is capitulation-style but confirms real distribution. [Bearish – heavy volume on the decline]
Other moving averages and levels: price is below SMA200D ($63.78), SMA50D ($65.43) and VWAP ($65.72). The SMA50D at $65.43 is still above the SMA200D at $63.78, so there is no death cross yet, but the gap is narrowing (about $1.65 now vs $3.3 on Oct 19). EMA21 crossed below EMA55 around Oct 12-13, a bearish crossover already in force.
DIVERGENCES & TRENDS
- No bullish divergence yet: Price made a new low at about $58.05 on Nov 5, and RSI hit 26.6, the lowest of the period. Momentum confirmed the price low, so there is no divergence to signal an exhaustion.
- MACD trend: MACD fell to its lowest level in the chart and keeps making lower lows, with no sign of flattening.
- Moving average structure: Price fell through the SMA200D (~$63.8) in mid-October, and that level, along with the EMA21, is now overhead resistance. The EMA21 and EMA55 are both falling, and the SMA50D has turned down, which points to a deteriorating long-term trend.
- Trend in ADX/DI: ADX has climbed from below 20 to nearly 33, a trend-strength confirmation. −DI has been above +DI since early October.
- CMF: It has swung from positive to a sharply negative reading in the last few bars, consistent with a distribution break.
- Oversold caution: RSI at 26.6 followed by 34.1 and a price tag of the lower Bollinger Band make a relief bounce toward $61-62 plausible, but it would likely face resistance at the falling EMA21.
CHART PATTERNS
- Bearish continuation / breakdown structure: The chart shows a series of lower highs and lower lows since mid-October after the failed range between ~$63 and ~$69 held from July to early October. The break of that range (and of the SMA200D) resembles a Bearish Flag/Pennant continuation in the diagram: a small consolidation around $61-$63.5 in late October (Oct 22-Nov 4), followed by a breakdown on Nov 5 with a large red candle on heavy volume.
- Measured move: The flag pole from about $66 down to $61.5 is roughly $4.5. Breaking the consolidation floor of about $61 projects toward ~$56.5-57. That is consistent with a bearish pennant/flag target.
- Range breakdown: The multi-month trading range (about $63-69) has been resolved to the downside, a bearish reversal sign comparable to a Triple Top (as in the diagram's Bearish Triple Top), whose measured target is about the range height of ~$5-6 below the support at ~$63, i.e. ~$57-58.
- Caveat: The Nov 6 bounce candle is a small green rebound, so a short-term retest of $61-62 is possible before continuation.
POTENTIAL SCENARIOS
- Scenario 1: Bearish Trend Continuation — Price stays under the falling EMA21 and SMA200D with −DI dominant and CMF in distribution, completing the flag/pennant measured move. Trigger: close below $58.05 (the Nov 5 low), or failure at the $61-62 area. Target: $55.50-$57.00. Invalidation: daily close above $62.50 (EMA21). (50% probability)
- Scenario 2: Neutral/Choppy Oversold Base — After the RSI 26.6 and lower-band tag, price oscillates between about $57.50 and $62 as selling exhaustion offsets weak momentum. Trigger: holds $57.50-$58 for a couple of weeks with RSI above 30. Target: $58.50-$61.00. Invalidation: close below $57.50 or above $62.50. (25% probability)
- Scenario 3: Bullish Relief Rally / Mean Reversion — Capitulation-volume low on Nov 5 leads to a bounce toward the falling EMA21 and the SMA200D. Trigger: close above $61.70 with RSI rising above 45 and MACD histogram shrinking. Target: $62.50-$63.80. Invalidation: rejection at $62.50 and a close below $58.00. (25% probability)
PRICE TARGETS
For the 34-day timeframe (to Dec 12, 2026), the range width is about 15% of price, which is in the 12-18% band for 30-60 days.
- Target Price: $57.60 (34-day)
- Expected Range: $53.50 to $62.30 ($8.80 width ≈ 14.8% of current price)
- Key Levels: Support at $58.05 (Nov 5 low; then $56.50), Resistance at $61.70 (then EMA21 near $62.47)
OVERALL BIAS
OVERALL BIAS: BEARISH - Strong, rising ADX (32.9) with −DI at 45.1 versus +DI at 17.9, a MACD bear cross widening below zero, price under all key moving averages including the SMA200D, and CMF at -0.163 all point to continued downside. The oversold RSI could allow a bounce to $61-62, but rallies are likely to be sold under the EMA21.
This is educational analysis and not financial advice.