GLD 34-day bearish forecast — Nov 8, 2026
- Bias: Bearish
- Timeframe: 34 days (made Nov 8, 2026, target date Dec 11, 2026)
- Price at analysis: $372.52
- Price target: $364.00
- Expected range: $342.00 – $396.00
- Result: Pending — graded after the close on Dec 11, 2026
Get a free AI analysis of GLD today
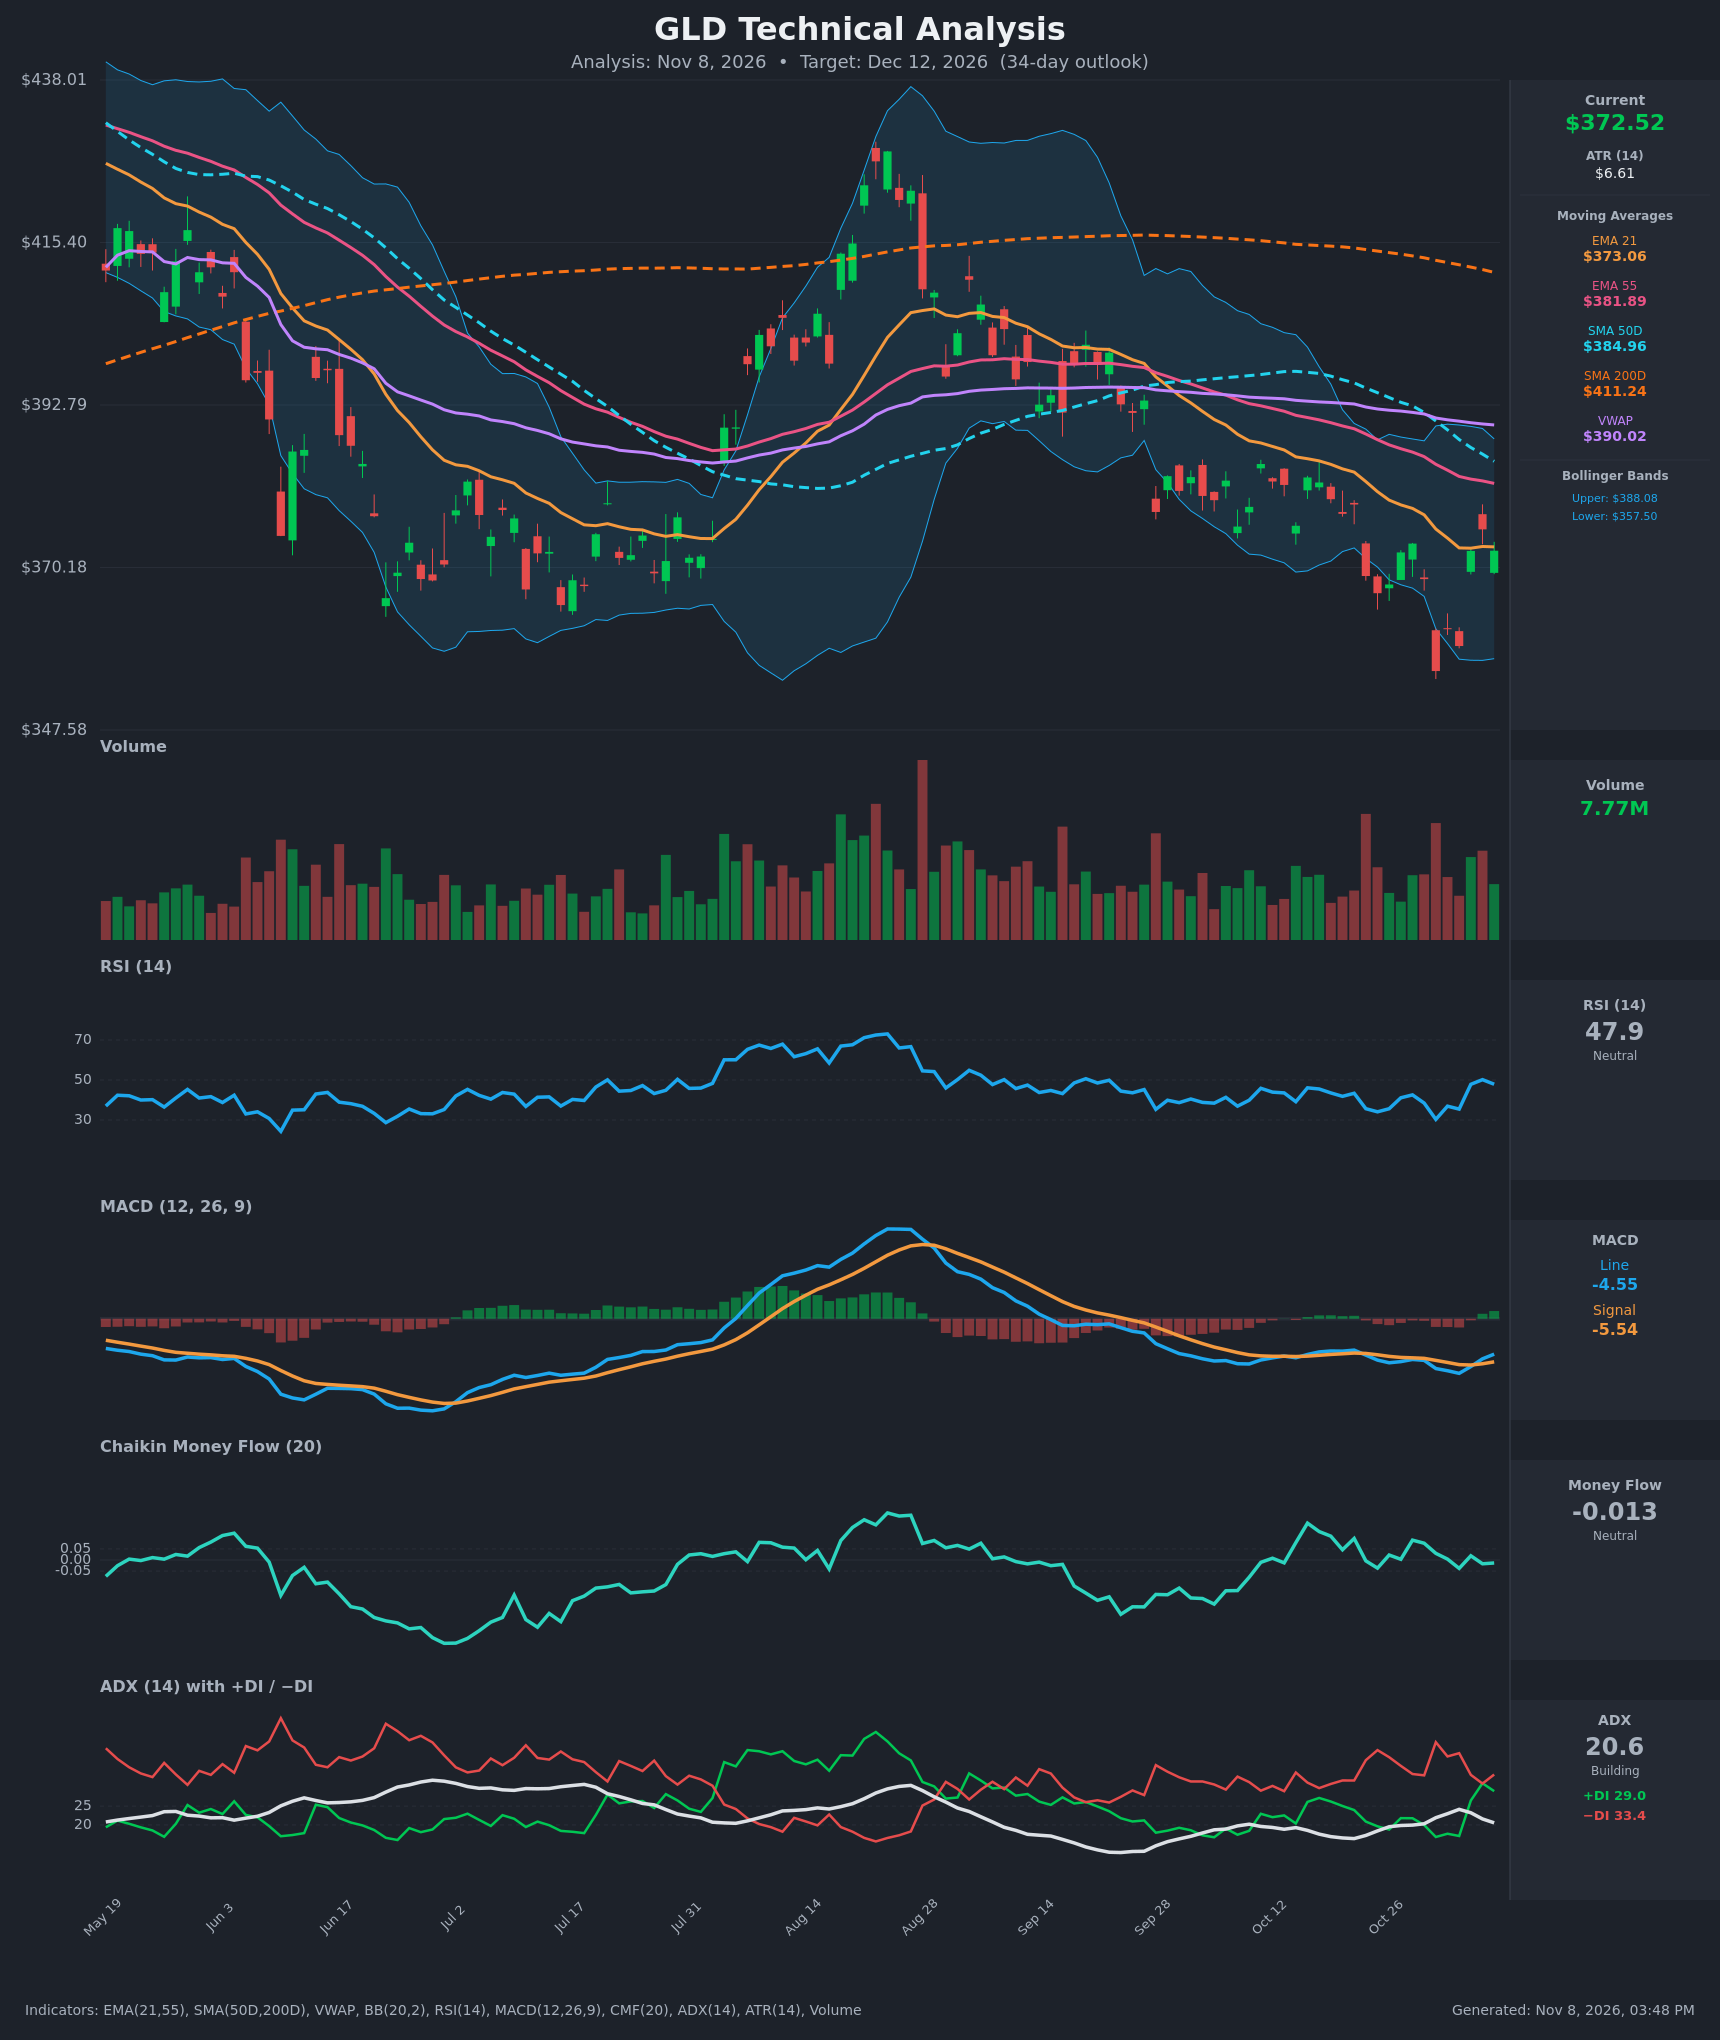
Analysis
TECHNICAL INDICATORS
- RSI (14): 47.89, back near the midline after bouncing from 30.3 on Oct 30 and 35.4 on Nov 3. Momentum is recovering, but there is no strong signal either way. [Neutral]
- 20 EMA: The EMA21 is $373.06 and price ($372.52) is sitting right on it. It has flattened after a steady decline. EMA55 ($381.89) is overhead and still falling, with EMA21 well below it. This is a bearish alignment unless price reclaims the EMA21 cleanly. [Bearish]
- MACD: Line is -4.55 and signal is -5.54. The line crossed above the signal on about Nov 5-6, so the histogram is positive and rising. Both lines are still below zero, so this is an early bounce signal inside a bearish regime. [Bullish]
- Bollinger Bands (20): Upper is $388.08, lower $357.50 and midline about $372.79. Price is pinned at the midline after touching the lower band area on Oct 30 ($355.78 close). Bandwidth is moderate, about 8%. The reading is neutral and the bands are drifting lower. [Neutral]
- CMF (20): -0.013, inside the ±0.05 neutral band. It has oscillated around zero for weeks with no sustained accumulation. [Neutral]
- ADX (14): 20.6 and falling from 24.1. −DI (33.4) is above +DI (29.0), though the gap has narrowed from 39 vs 17 on Nov 3. The trend is weak, with a mild bearish tilt. [Weak Trend, Bearish lean]
- Volume: 7.77M, roughly average. The Nov 4-6 bounce came on unremarkable volume, so there is no strong sign of capitulation or a decisive buying surge. [Neutral]
DIVERGENCES & TRENDS
- Price made a lower low on Oct 30 ($355.78) and RSI hit 30.3. The earlier RSI lows were in the same area, so there is no clear bullish divergence, only an oversold bounce.
- MACD bullish crossover (Nov 5-6) while below zero is a weaker signal than one above zero.
- The SMA50 ($384.96) is below the SMA200 ($411.24), a confirmed death-cross regime, and both are declining. Price is below the SMA200 by about 9.4%.
- Price is below VWAP ($390.02), the SMA50 and the EMA55. Only the EMA21 is being tested.
- The −DI/+DI gap is narrowing and ADX is fading, so selling pressure is easing. Even so, the broader structure of lower highs since the late-August peak (~$438) stays intact.
- The EMA21 is converging toward flat while the EMA55 and SMA50 slope down. Reclaiming $382-$385 would be the first real sign of trend repair.
CHART PATTERNS
- Since the August peak, price has been making lower highs and lower lows, a descending channel. The recent bounce looks like a Bearish Flag/Pennant-type continuation (the diagram's bearish continuation patterns) beneath the declining EMA55/SMA50 cluster. The measured-move target is the Oct 30 low area ($355) and then the $343-$347 zone.
- The Oct decline also resembles a Bullish Falling Wedge, with narrowing lower highs and lows and a bounce off the lower band. It would need a break above about $382-$385 (EMA55/SMA50) to confirm, with a target near $395-$400.
- The pattern read is unresolved, but the dominant structure (price below every longer-term average) favors the bearish continuation.
POTENTIAL SCENARIOS
- Scenario 1: Bearish Continuation Lower — The bounce stalls at the EMA55/SMA50 resistance cluster, and the descending channel resumes with a retest of the October low. Trigger: rejection at $381-$385 or a daily close below $366. Target: $355-$358, with an extension to $345. Invalidation: daily close above $385 with rising volume. (45% probability)
- Scenario 2: Bullish Reversal / Falling-Wedge Breakout — The MACD cross and the rebound from oversold carry price through the EMA55 and SMA50. Trigger: close above $382 with CMF turning above +0.05. Target: $388-$397 (upper Bollinger, VWAP and then toward the SMA200 at $411). Invalidation: close back below $357. (35% probability)
- Scenario 3: Neutral Range Consolidation — Weak ADX keeps price between the October low and the EMA55. Trigger: failure to break either $357 or $382. Target: $362-$378 range. Invalidation: close outside $355-$385. (20% probability)
PRICE TARGETS
For the 34-day horizon (to Dec 12, 2026), the range is widened to about 14.5% of the current price: $54 width / $372.52 ≈ 14.5%, consistent with the 12-18% guidance for 30-60 days.
- Target Price: $364.00
- Expected Range: $342.00 to $396.00
- Key Levels: Support at $355.78, Resistance at $381.89
OVERALL BIAS
OVERALL BIAS: BEARISH - Price is below the EMA55, SMA50, SMA200 and VWAP, with a confirmed death-cross structure and −DI above +DI. The MACD crossover and oversold bounce keep the call modest, and a reclaim of $382-$385 would negate it.
This is educational analysis and not financial advice.