MSTR 34-day bearish forecast — Nov 8, 2026
- Bias: Bearish
- Timeframe: 34 days (made Nov 8, 2026, target date Dec 11, 2026)
- Price at analysis: $128.93
- Price target: $120.00
- Expected range: $109.00 – $135.50
- Result: Pending — graded after the close on Dec 11, 2026
Get a free AI analysis of MSTR today
Analysis
TECHNICAL INDICATORS
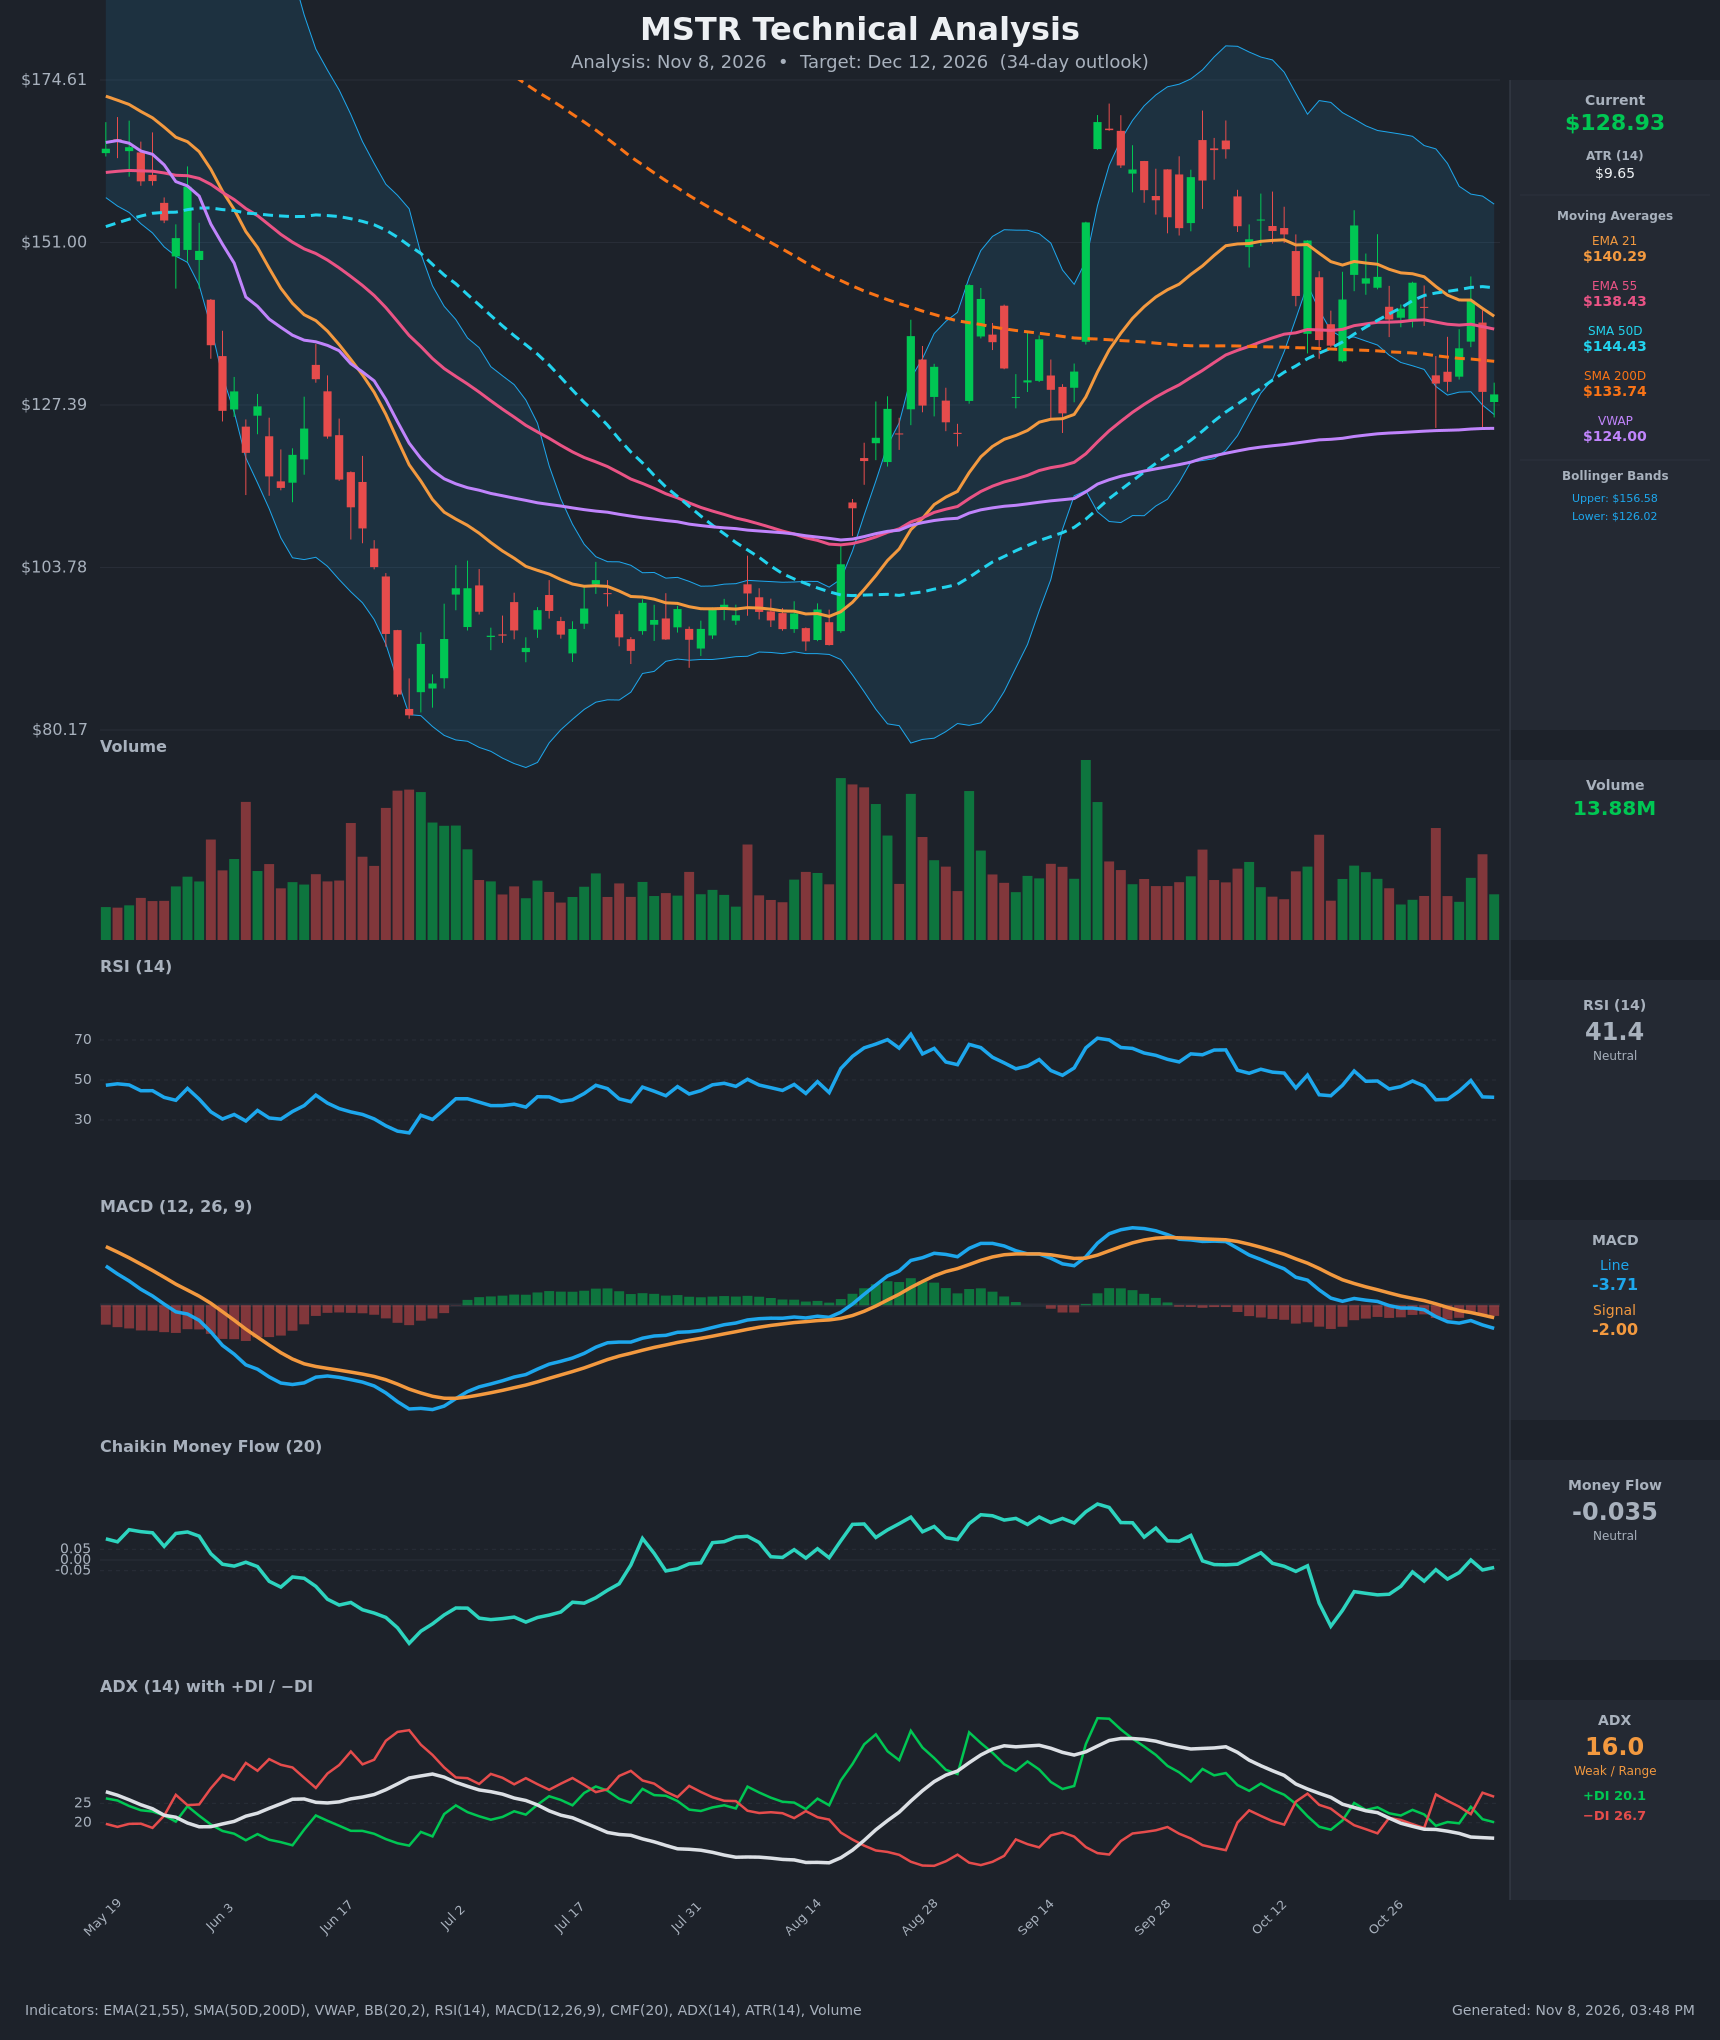
- RSI (14): 41.35, below the 50 midline and sliding after failing near 50 on Nov 4 (49.7). It is not oversold, so there is room to fall further, and momentum is tilted down. [Bearish]
- 20 EMA: The EMA 21 is $140.29 and price at $128.93 is about 8% below it. The EMA has been falling steadily from about $148, so it acts as overhead resistance. [Bearish]
- MACD: The line is -3.71 and the signal is -2.00, with the line below the signal and the gap widening. The bearish crossover happened around Oct 26, and the histogram is increasingly negative. [Bearish]
- Bollinger Bands (20): Upper is $156.58 and lower is $126.02. Price is near the lower band (about 9% of the band width above it), and the bands are contracting after the earlier volatility expansion. Repeated tests of the lower band could produce a bounce, but a close below it would signal continuation lower. [Neutral]
- CMF (20): -0.035, inside the neutral band (±0.05). It has recovered from a deep low of about -0.31 (Oct 19) but has not turned positive, so buying pressure is lacking. [Neutral]
- ADX (14): 16.0, which is weak or range-bound. −DI (26.7) is above +DI (20.1), so bears have a modest edge, and the −DI/+DI crossover back to bearish occurred on Oct 30. The downtrend is not yet strong. [Weak Trend, bearish lean]
- Volume: 13.88M, average to slightly below average. There has been no capitulation or accumulation surge, and the heavy-volume candles were red during the Oct 30 and Nov 5 drops. [Mildly bearish / lacking conviction]
DIVERGENCES & TRENDS
- Price is trading below EMA21 ($140.29), EMA55 ($138.43), and SMA50D ($144.43). The EMA21 is converging toward the EMA55 and may cross below it soon, which would be a bearish signal.
- Price is still below the SMA200D ($133.74) after losing it in early November. It has been a flat resistance level, and it was lost on the Nov 5 drop.
- SMA50D ($144.43) is above SMA200D ($133.74) and is rolling over. No death cross has occurred, but the gap is narrowing.
- Price is above VWAP ($124.00), which is the nearest structural support. VWAP and the lower Bollinger band ($126.02) form a support zone around $124–126.
- There is no clear divergence. RSI and MACD confirm the lower price highs. The CMF improvement from -0.31 is a mild positive, but it is still not above zero.
- The MACD bearish crossover and negative −DI dominance point to a corrective phase after the September–October rally, which failed near $170 (Sep) and $165 (early Oct).
- The lower highs ($153 → $146 → $142) combined with a floor near $128–130 show a compressing range.
CHART PATTERNS
- Descending Triangle / Bearish Pennant-like structure: Lower highs ($153.5 → $146 → $145 → $142.5) press against horizontal support near $128–130, which was tested on Oct 30, Nov 5, and Nov 6. A break below ~$126 (the lower band, near VWAP) would project toward the measured move of roughly $110–115.
- Possible Double Top (macro): The Sep and Oct highs near $165–170 both failed. The neckline near $126–128 is being tested now, and a break would target about $105–110.
- The bullish counter-scenario is a failed breakdown that reclaims $134 (SMA200D) and rebounds into the $140s.
POTENTIAL SCENARIOS
- Scenario 1: Bearish Support Break — Price loses the $126–128 floor (lower Bollinger band, near VWAP), with MACD still falling and −DI above +DI. Trigger: daily close below $125 on rising volume. Target: $112–115, with $105 as an extension. Invalidation: daily close above $134 (SMA200D). (50% probability)
- Scenario 2: Neutral Range Chop — The floor around $124–128 holds, but resistance at $134–141 caps rallies, with ADX staying below 20. Trigger: repeated bounces off the lower band with no volume expansion. Target: $122–138. Invalidation: close outside $122–140. (22% probability)
- Scenario 3: Bullish Reversal — The lower band and VWAP hold, price reclaims SMA200D and EMA55 on a CMF turn positive. Trigger: close above $138.5 (EMA55). Target: $145–150 (SMA50D and EMA21 zone). Invalidation: close below $124. (28% probability)
PRICE TARGETS
For a 34-day timeframe the expected width should be about 12–18% of current price. The range of $109.00 to $135.50 is $26.50 wide, or 20.6% of $128.93. That is slightly above the guidance but is justified by the high-volatility asset (ATR of $9.65, about 7.5% of price). Target price: $120.00, about 6.9% below current price.
- Target Price: $120.00 (for 34 days)
- Expected Range: $109.00 to $135.50
- Key Levels: Support at $124.00 (VWAP), Resistance at $133.74 (SMA200D)
OVERALL BIAS
OVERALL BIAS: BEARISH - Price is below the EMA21, EMA55, and SMA50D with a widening bearish MACD gap, −DI above +DI, and repeated failed rallies. The lower-highs structure presses on the $126–128 floor, so a break there looks more likely than a reclaim of the SMA200D at $133.74.
This is educational analysis and not financial advice.