MARA 34-day bearish forecast — Nov 8, 2026
- Bias: Bearish
- Timeframe: 34 days (made Nov 8, 2026, target date Dec 11, 2026)
- Price at analysis: $6.35
- Price target: $5.85
- Expected range: $4.95 – $7.15
- Result: Pending — graded after the close on Dec 11, 2026
Get a free AI analysis of MARA today
Analysis
TECHNICAL INDICATORS
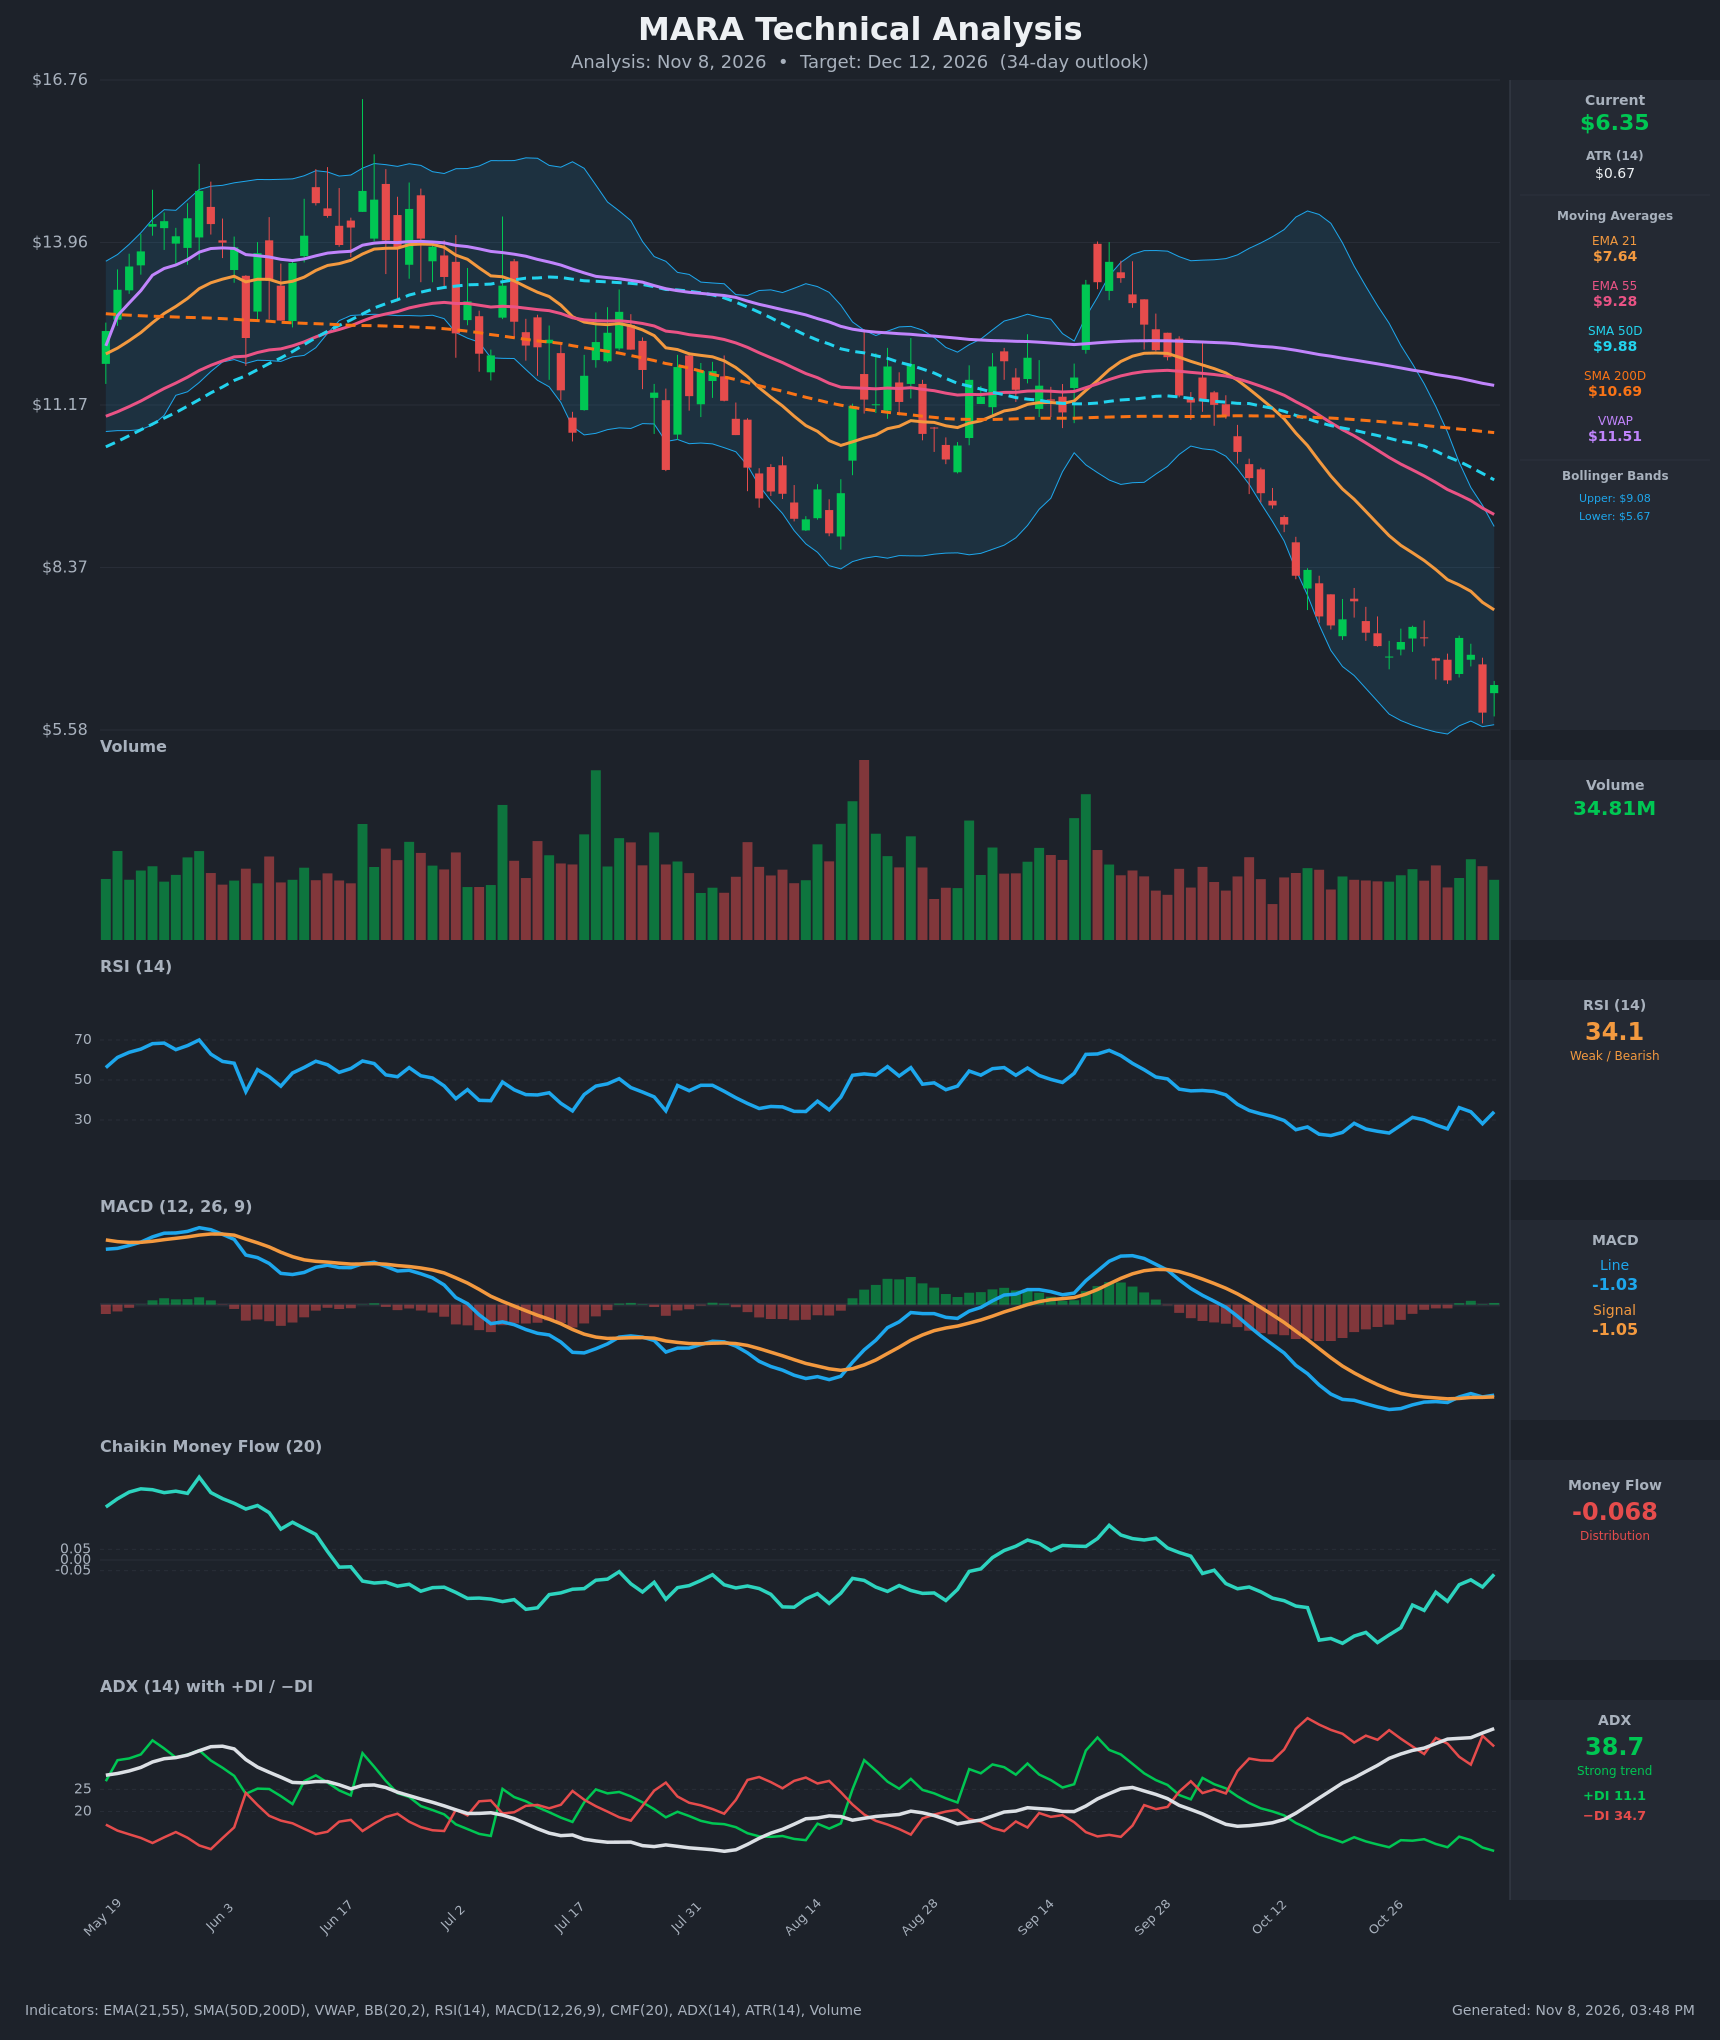
- RSI (14): 34.07, up from 28.1 on Nov 5 and just above oversold. It has stayed between 22 and 36 for about three weeks, which is a bear-market range. Momentum is weak and shows only a small bounce. [Bearish]
- 20 EMA: The EMA 21 is $7.64 and falling steeply (it was $9.95 on Oct 19). Price at $6.35 is about 17% below it, so the EMA acts as overhead resistance. EMA 21 < EMA 55 ($9.28) < SMA50D ($9.88) < SMA200D ($10.69) < VWAP ($11.51) is a fully bearish stack. [Bearish]
- MACD: The line is -1.026 and the signal is -1.046. The line has just crossed marginally above the signal, with a histogram of about +0.02. Both lines are deeply negative and near their lows, and the flattening suggests selling momentum is fading. This is only a tentative bullish crossover below zero. [Neutral]
- Bollinger Bands (20): The bands run from $5.67 (lower) to $9.08 (upper). Price at $6.35 is in the lower quarter of the band. The Nov 5 close of $5.88 pierced the lower band, and the following bounce is modest. Price has been walking the lower band, which marks a strong downtrend, and the bands are still wide. A mean-reversion bounce is possible but would meet resistance well below the mid-band. [Bearish]
- CMF (20): -0.068, in distribution territory but improving from -0.39 on Oct 20 toward -0.07. Selling pressure is easing but has not turned into accumulation. [Distribution]
- ADX (14): 38.7 and rising, with -DI at 34.7 and +DI at 11.1. -DI is far above +DI, which means a strong, mature downtrend with bears firmly in control. ADX this high can precede exhaustion, but there is no sign of a DI crossover. [Strong Trend – Bearish]
- Volume: 34.81M, roughly average with no capitulation spike. The last bars show no heavy-volume washout that would mark a bottom, and the Nov 5 breakdown candle drew only moderate volume. [Neutral to mildly Bearish]
DIVERGENCES & TRENDS
- Positive divergence building: Price made a new low on Nov 5 ($5.88) below the Oct lows, while the MACD line is higher than in late October and has crossed above its signal. CMF has also risen from about -0.39 to -0.07. RSI made a higher low (28.1 versus 23.5 on Oct 26). Together these suggest selling is losing force.
- Trend remains down: Price is below every moving average and VWAP. EMA 21 and EMA 55 are sloping down, and price is about 41% below the SMA200D. The SMA50D ($9.88) is crossing below the SMA200D ($10.69). The gap is narrowing quickly, so a death cross is likely within a few weeks if the decline persists.
- ADX/DI: -DI has been dominant since early October and ADX is still rising, so the trend is not yet losing strength.
- Rejections: Each bounce (Oct 21 at $7.79, Oct 28 at $7.35, Nov 3 at $7.16) failed at lower highs, which shows a clear descending structure.
CHART PATTERNS
- Primary: Bearish continuation / descending channel. Price has made lower highs and lower lows since the September peak near $13. The recent consolidation between roughly $6.4 and $7.8 with declining highs resembles a Bearish Pennant / Flag after the sharp October drop. The Nov 5 break below $6.4 supports a downside resolution, with a measured move toward about $5.0–$5.5.
- Secondary: Possible Bullish Falling Wedge. The converging lower highs and lower lows with fading MACD and RSI divergence hint at a wedge. It has not been confirmed by a breakout, and the nearest breakout level is about $7.2–$7.6 (EMA 21 and the descending trendline). Until then it is a low-probability reversal setup.
- Overhead resistance zones: $7.16–$7.64 (recent swing high and EMA 21), then $9.08 (upper BB) and $9.28–$9.88 (EMA 55 and SMA50D).
POTENTIAL SCENARIOS
- Scenario 1: Bearish Trend Continuation — The established downtrend persists with the pennant breakdown as bounces fail below the EMA 21. Trigger: close below $5.88 (Nov 5 low), with -DI staying above 30. Target: $5.00–$5.50, with an extension to about $4.80. Invalidation: daily close above $7.65 (EMA 21). (50% probability)
- Scenario 2: Neutral/Bullish Relief Bounce, Then Fade — The oversold RSI, positive MACD cross and CMF improvement drive a mean-reversion bounce toward the middle of the range, which then stalls under resistance. Trigger: hold above $5.88 and close above $7.00. Target: $7.20–$7.80. Invalidation: close below $5.80. (35% probability)
- Scenario 3: Bullish Reversal (Falling Wedge Breakout) — Capitulation lows give way to a breakout above the EMA 21 and descending trendline with improving volume. Trigger: close above $7.65 on rising volume. Target: $8.50–$9.10 (BB upper). Invalidation: failure at $7.65 and a close below $6.00. (15% probability)
PRICE TARGETS
For a 34-day horizon (30–60 day guidance of ~12–18% width), the bearish scenario is the most probable, tempered by the oversold bounce potential.
- Target Price: $5.85 (about 7.9% below current)
- Expected Range: $4.95 to $7.15 (width $2.20, about 34.6% of current price). This is wider than the 12–18% guide, and I justify it because ATR is $0.67 (about 10.6% of price) and volatility is very high; over 34 days a plausible one-sigma move is far larger than the guide, so a tighter band would be unrealistic. A strict-formula range would be about $5.35 to $6.55 (19%), but the high ATR supports the wider band.
- Key Levels: Support at $5.67 (lower Bollinger Band), with $5.00 psychological support below. Resistance at $7.16 (recent swing high), then $7.64 (EMA 21).
OVERALL BIAS
OVERALL BIAS: BEARISH - Price sits below all moving averages and VWAP, -DI (34.7) dominates +DI (11.1) with ADX at 38.7, and CMF remains in distribution, so the path of least resistance is down. Tentative MACD and RSI improvement points to a possible relief bounce, but it would likely fade below the $7.64 EMA 21.
This is educational analysis and not financial advice.