IREN 34-day bearish forecast — Nov 8, 2026
- Bias: Bearish
- Timeframe: 34 days (made Nov 8, 2026, target date Dec 11, 2026)
- Price at analysis: $21.64
- Price target: $20.00
- Expected range: $18.20 – $22.00
- Result: Pending — graded after the close on Dec 11, 2026
Get a free AI analysis of IREN today
Analysis
TECHNICAL INDICATORS
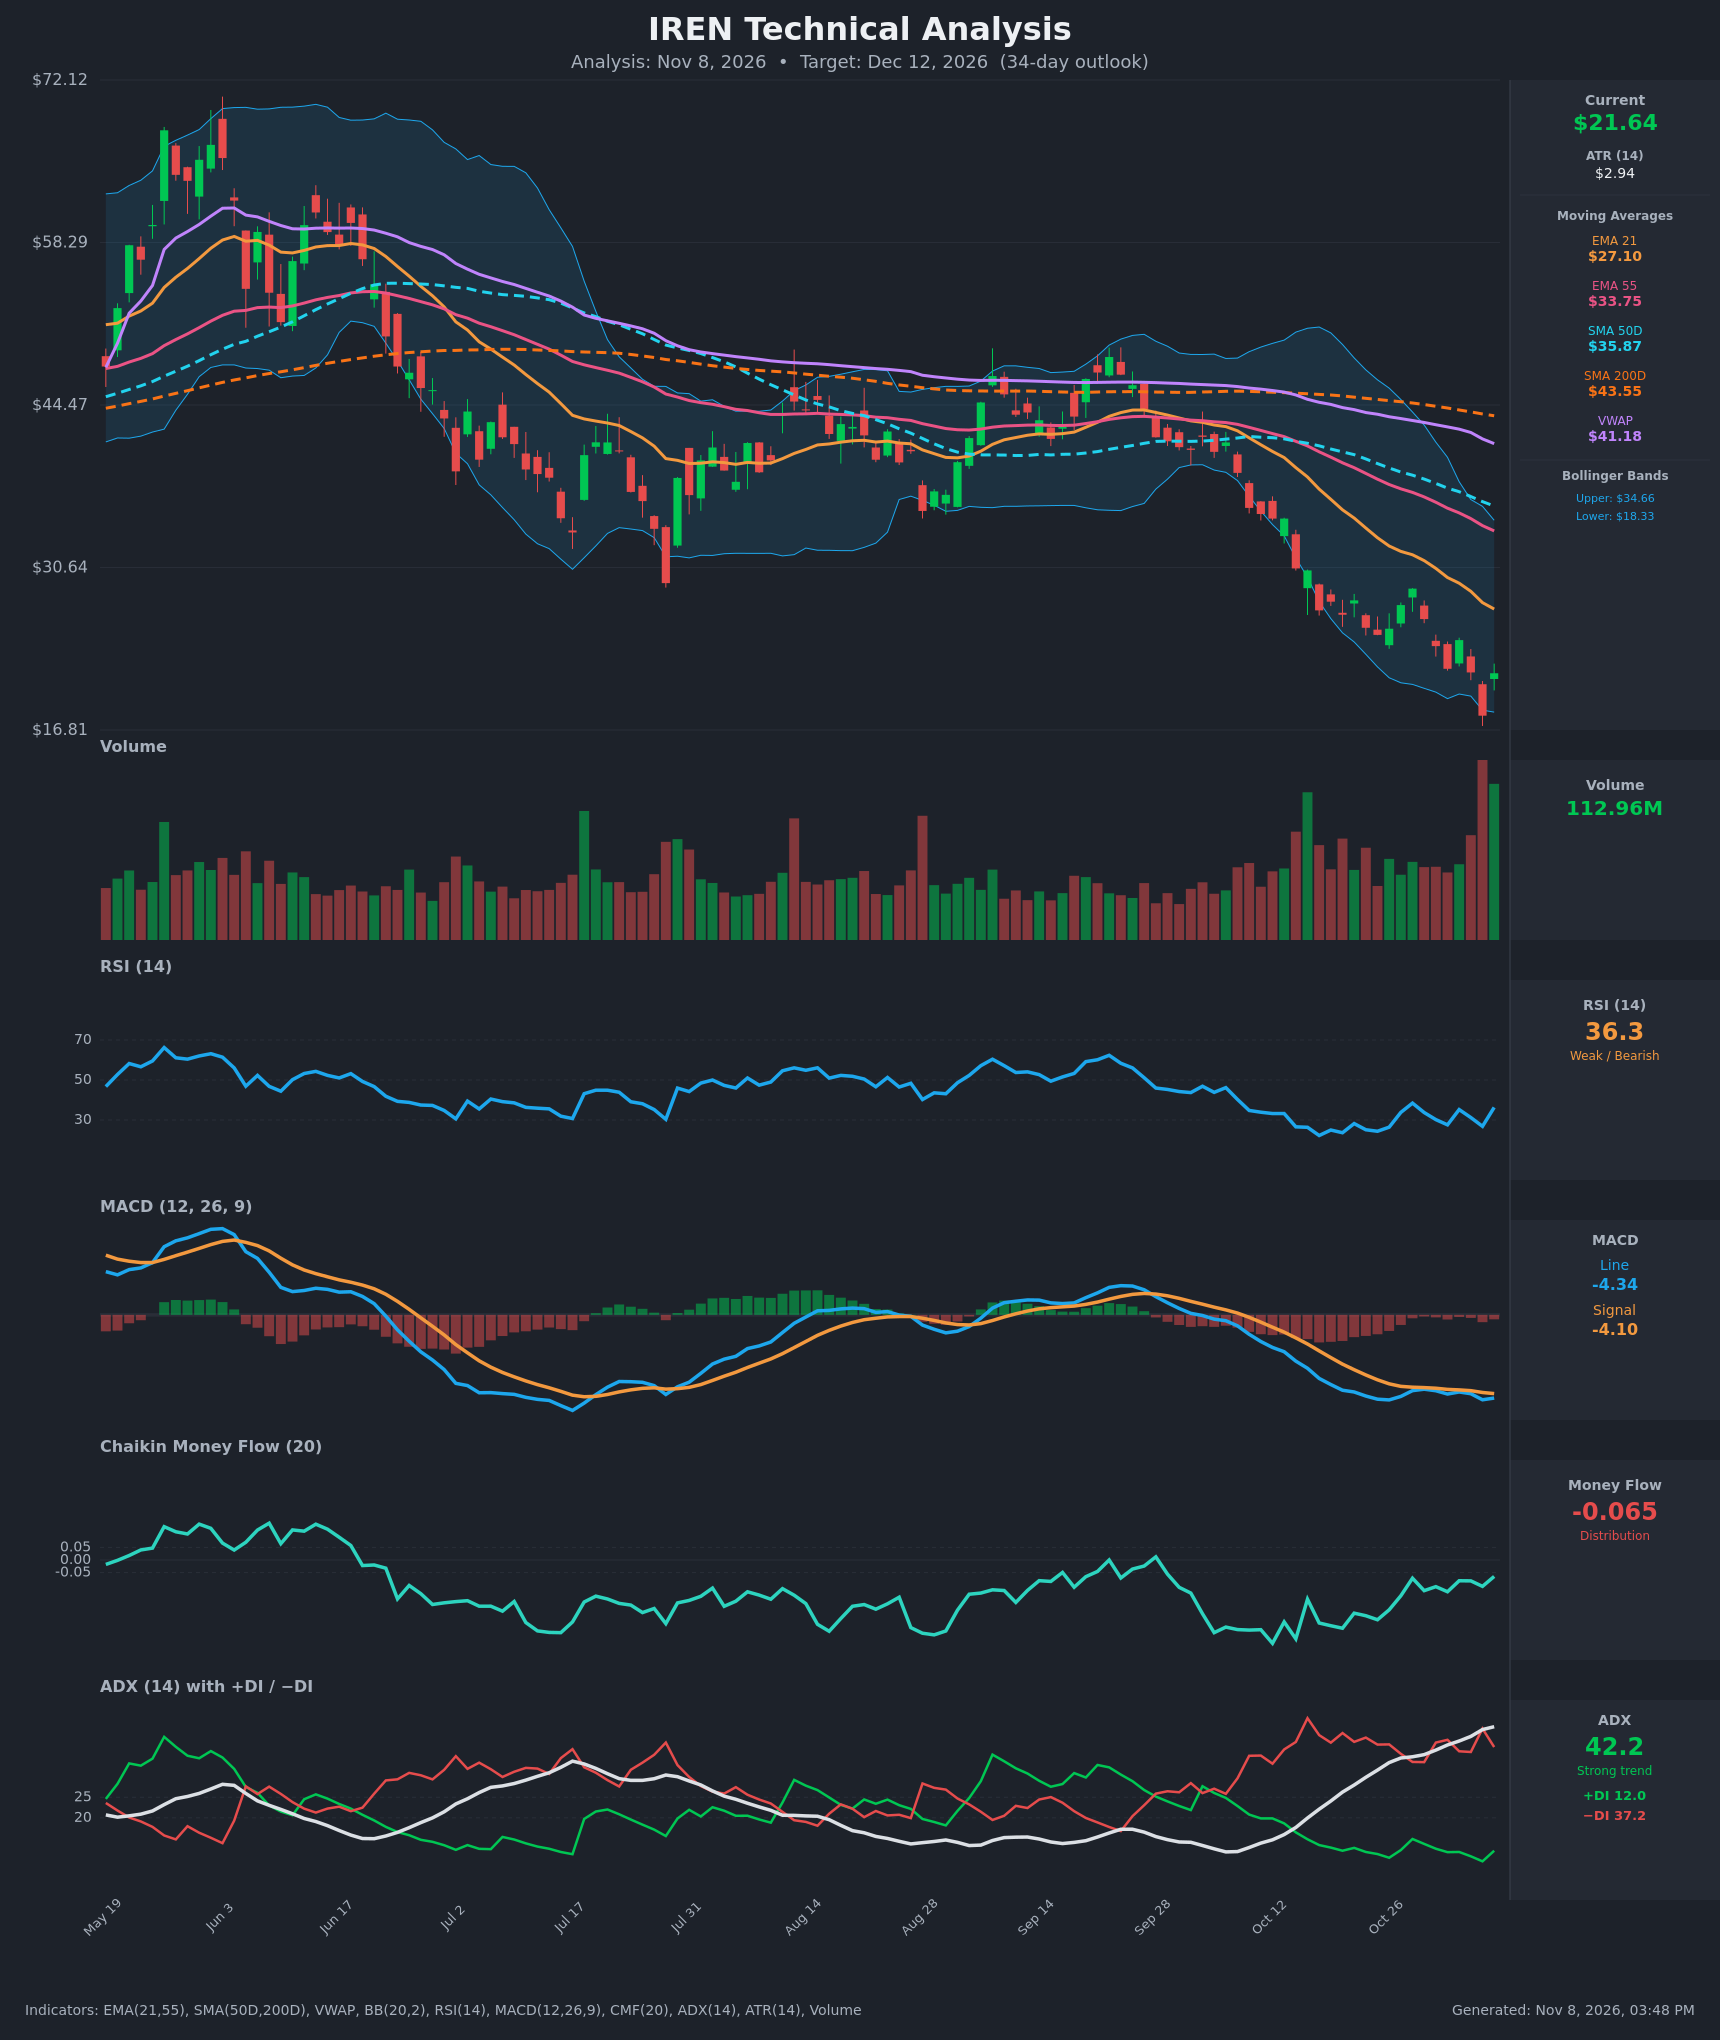
- RSI (14): 36.29, bouncing from 26.8 the prior day and below the 50 midline. Over the last 15 bars it has been mostly below 35 and made a higher low (26.8 vs 23.6) while price made a lower low. Momentum is stabilizing but still weak. [Bearish]
- 20 EMA: The 21 EMA is $27.10 and falling steeply (from $36.44 on Oct 19). Price is about 20% below it, so it acts as overhead resistance. The 21 EMA is also below the 55 EMA ($33.75), a bearish alignment. [Bearish]
- MACD: Line -4.335 is below signal -4.103 with a negative histogram, so there is no bullish crossover. The line is flat since Oct 26 (-4.43) even though price made a much lower low, which suggests downside momentum is fading. [Bearish]
- Bollinger Bands (20): Price is $21.64 vs a lower band of $18.33, a midline near $26.5 and an upper band of $34.66. The bands are very wide (high volatility). Nov 5 pierced the lower band at $18.03 and the Nov 6 close is back inside, which is a classic washout and snap-back. The path back to the midline is long. [Neutral]
- CMF (20): -0.065, slightly below the -0.05 distribution threshold. It has improved sharply from -0.27 on Oct 20, so selling pressure is easing but has not turned into accumulation. [Distribution]
- ADX (14): 42.2 and rising steadily (24 to 42 in 15 bars), with −DI at 37.2 well above +DI at 12.0. This is a strong, mature downtrend. ADX above 40 can also mark late-stage or exhaustion conditions, but there is no DI crossover. [Strong Trend – Bearish]
- Volume: 112.96M on the Nov 6 green bar, the highest of the visible period, following a similarly huge red bar on Nov 5. This looks like a climactic capitulation followed by a high-volume bounce. It is a potential bottoming clue, but it needs follow-through to confirm. [Capitulation / Possible Relief Bounce]
DIVERGENCES & TRENDS
- Moving averages: The structure is fully bearish. Price ($21.64) < EMA21 ($27.10) < EMA55 ($33.75) < SMA50D ($35.87) < VWAP ($41.18) < SMA200D ($43.55). The SMA50D is already below the SMA200D (death cross in place), and every average is sloping down.
- Bullish divergences (early, unconfirmed):
- RSI printed a higher low (26.8 on Nov 5) versus 23.6 on Oct 20, while price made a much lower low ($18.03).
- The MACD line is flat and has not made a new low.
- CMF has risen from -0.27 to -0.065.
- Bearish factors:
- There was no MACD bullish crossover; the line sits below the signal and the histogram is still negative.
- −DI dominates +DI by 25 points.
- Price is far below the 21 EMA, and rallies have failed at lower highs ($28.84 on Oct 28, $24.46 on Nov 3).
- Key break: The consolidation between roughly $24 and $29 (Oct 22 to Nov 4) broke down on Nov 5 with a -17% drop to $18.03. Nov 6 recovered about 20% of that.
CHART PATTERNS
- Bearish Flag / Pennant (continuation): The tight, slightly rising-to-sideways range from Oct 22 to Nov 4 at $24–29 resolved lower, as in the Bearish Flag/Pennant diagrams. The measured move (pole of about $10–12 from $36 to $25, projected from the breakdown near $24) points to roughly $12–14. That is an extended target outside this 34-day range, and the Nov 6 bounce suggests partial exhaustion.
- Possible Bullish Falling Wedge / Double Bottom (unconfirmed): The lower lows on tightening momentum (RSI/MACD) hint at a falling-wedge or double-bottom base around $18. It would need a close above about $24.50, then $27 (EMA21), to confirm. Until then it is only a hypothesis.
- Net read: The confirmed pattern is bearish continuation. The reversal pattern is not yet confirmed.
POTENTIAL SCENARIOS
- Scenario 1: Bearish Failed Bounce and Retest of Lows — The Nov 6 bounce stalls below $24–25 (the Nov 3 close and a gap-down zone) and falls back under the dominant −DI trend. Sellers then re-test the $18 capitulation low. Trigger: rejection at $23.50–$24.50 or a close back below $20. Target: $18.00–$20.00, with an extension to $16 if $18 breaks. Invalidation: a daily close above $27.10 (EMA21). (45% probability)
- Scenario 2: Bullish Relief Rally / Capitulation Reversal — Climactic volume, a lower-band reclaim, and RSI/CMF divergences produce a mean-reversion bounce toward the falling 21 EMA. Trigger: close above $24.50 on solid volume, followed by a MACD bullish crossover. Target: $26.00–$27.10. Invalidation: a close below $18.03. (35% probability)
- Scenario 3: Neutral Volatile Base — Price chops between $18 and $24.50 as the market digests the washout. Trigger: failed breaks of both $18 and $24.50. Target: $20–$23. Invalidation: a close outside $18–$24.50. (20% probability)
PRICE TARGETS
Timeframe: 34 days (target date about Dec 12, 2026). Range width: $22.00 − $18.20 = $3.80, which is about 17.6% of $21.64. This is within the 12–18% guidance for 30–60 days.
- Target Price: $20.00
- Expected Range: $18.20 to $22.00
- Key Levels: Support at $18.03, Resistance at $24.50
OVERALL BIAS
OVERALL BIAS: BEARISH - A strong, mature downtrend (ADX 42, −DI 37 vs +DI 12, price below every moving average, death cross in place, MACD below signal) outweighs the early divergences and the single-day capitulation bounce. The more likely path is a failed bounce below $24–27 and a retest of the $18 low, though the high-volume reversal bar leaves a meaningful chance of a relief rally.
This is educational analysis and not financial advice.