NIO 34-day bullish forecast — Nov 8, 2026
- Bias: Bullish
- Timeframe: 34 days (made Nov 8, 2026, target date Dec 11, 2026)
- Price at analysis: $3.39
- Price target: $3.55
- Expected range: $3.12 – $3.70
- Result: Pending — graded after the close on Dec 11, 2026
Get a free AI analysis of NIO today
Analysis
TECHNICAL INDICATORS
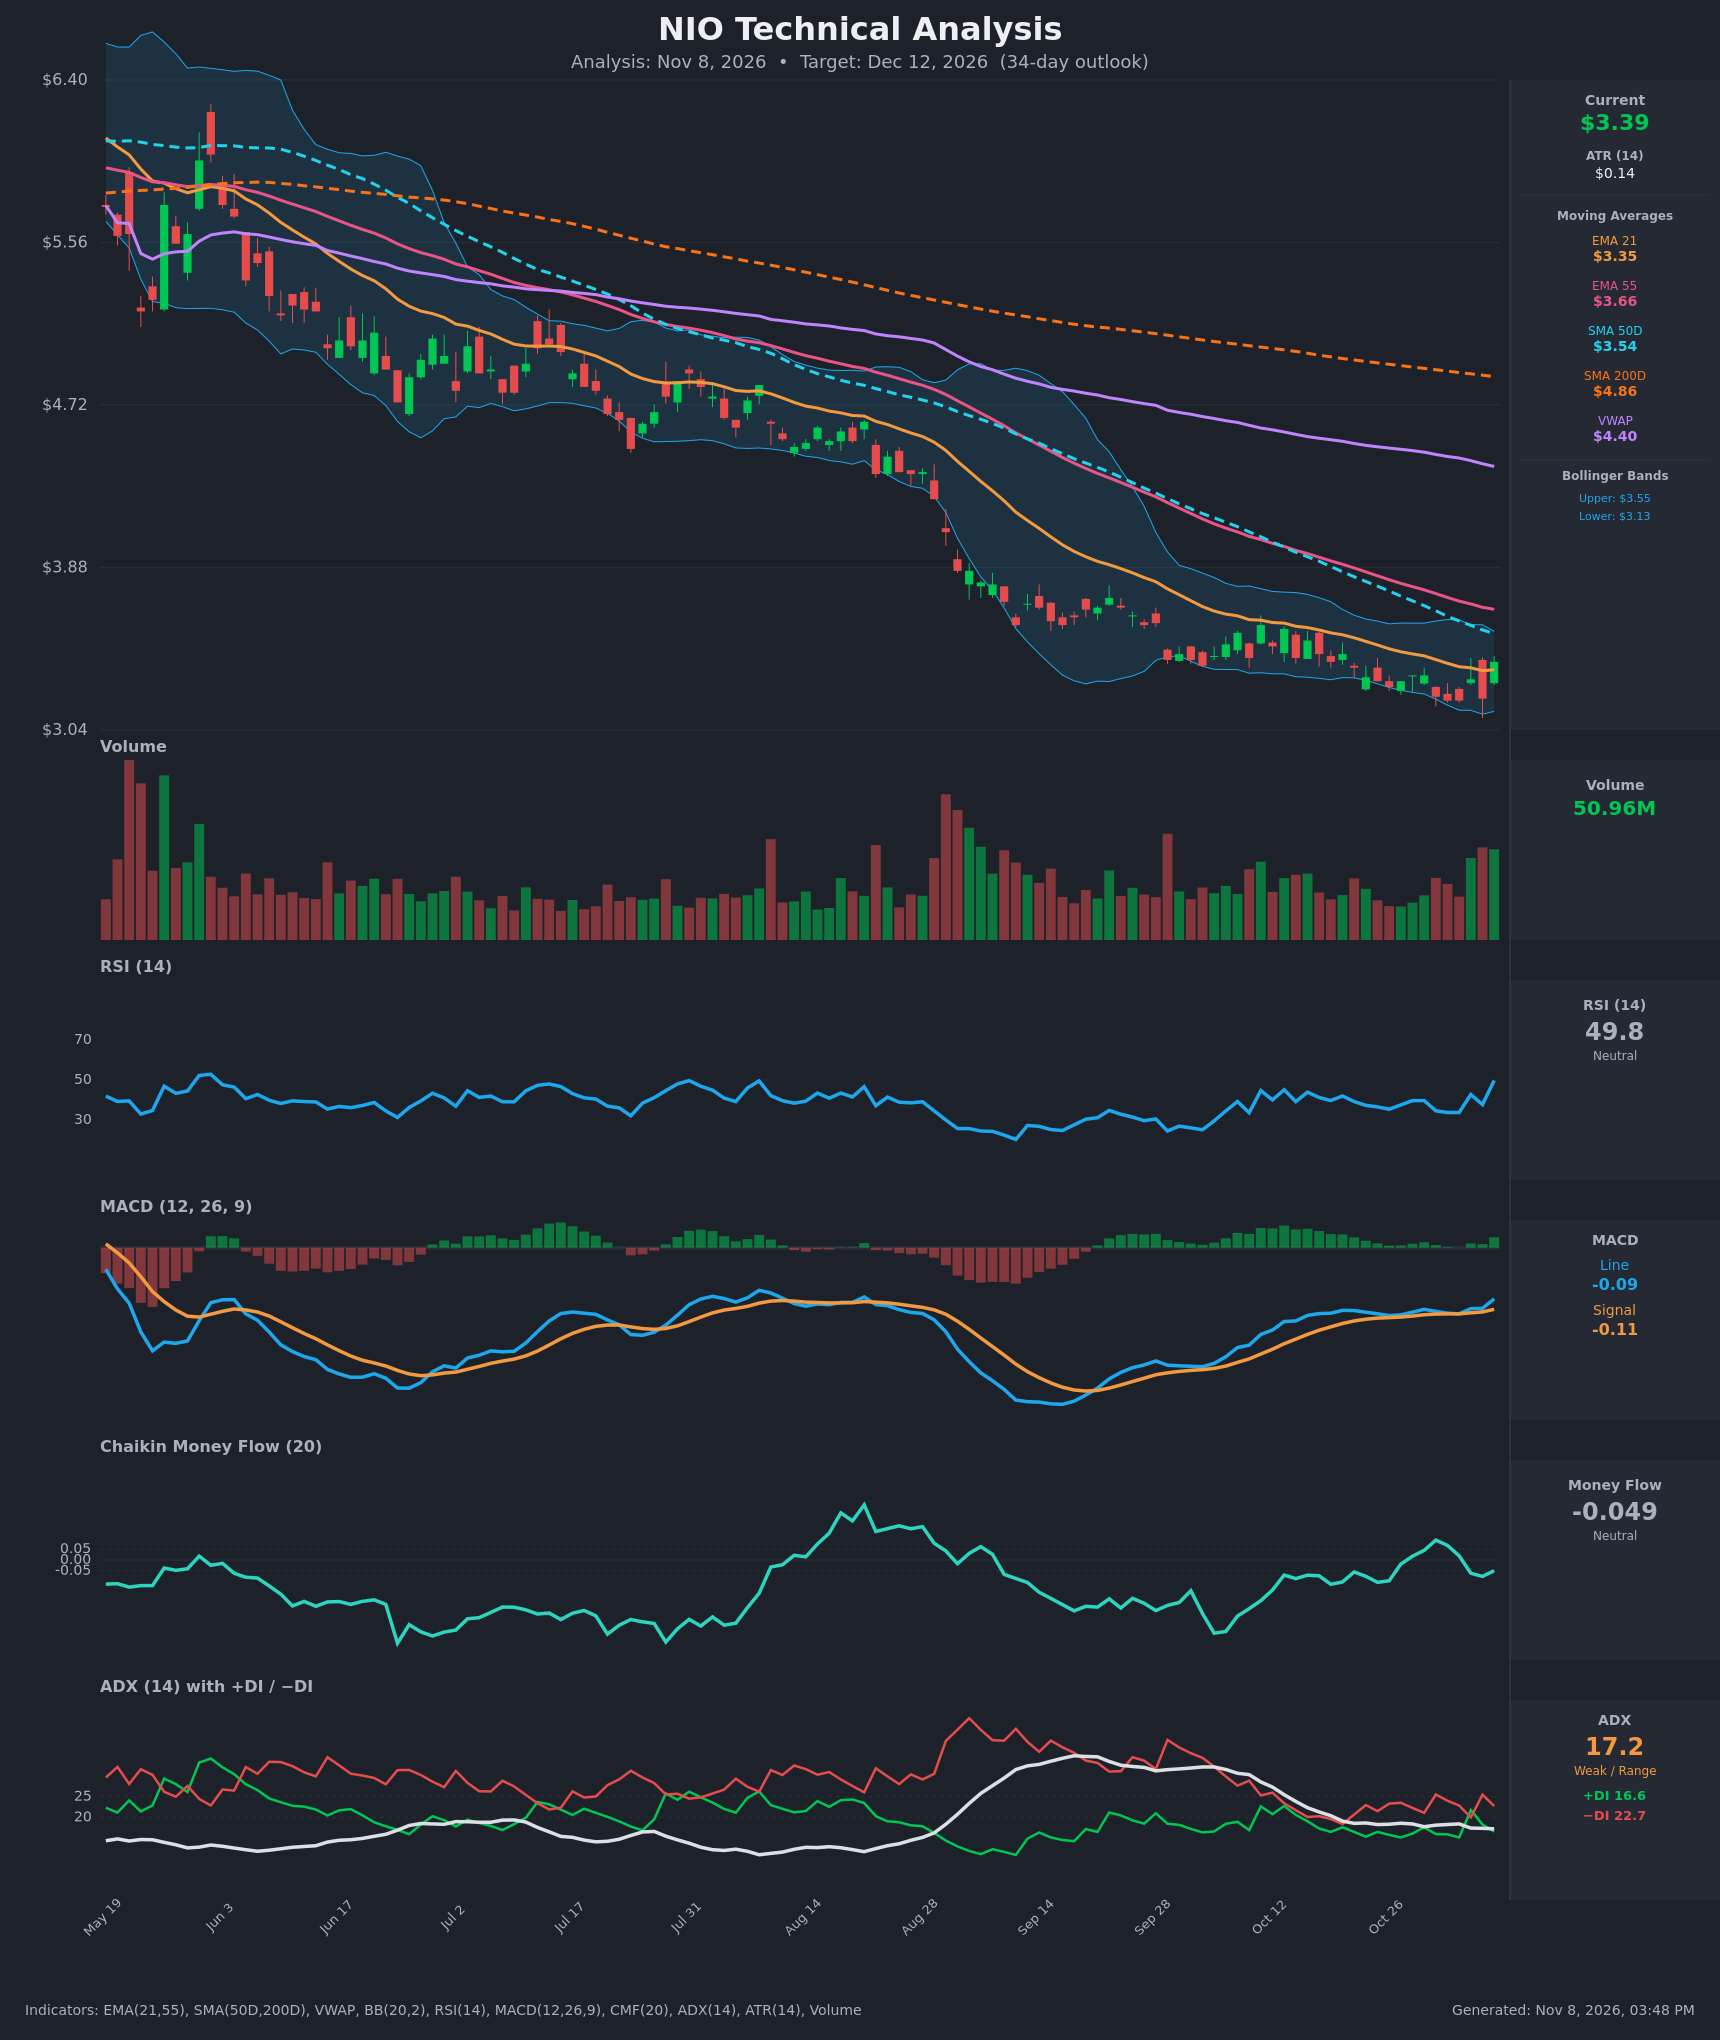
- RSI (14): 49.76, up sharply from 33.7 two sessions ago and back to the midline. It is a momentum recovery from near-oversold, but it has not yet cleared the 50-60 zone that would confirm a trend change. [Neutral]
- 20 EMA: The 21 EMA is $3.3487 and price at $3.39 has just reclaimed it after closing below it for most of the last 15 bars. The EMA is still sloping down. The 55 EMA at $3.6616 is overhead resistance, and the 21 EMA is well below the 55 EMA (bearish alignment). [Neutral]
- MACD: The line is -0.0899 and the signal is -0.1083. The line crossed above the signal on Nov 6 and the histogram turned positive (about +0.018), after weeks of flat, compressed readings. This is an early bullish crossover but both lines are still below zero. [Bullish]
- Bollinger Bands (20): Upper $3.5477, lower $3.1343, midline about $3.34. The bands are narrow, so volatility is compressed. Price rebounded off the lower band and now sits just above the midline, which points to a mean-reversion move toward the upper band near $3.55. [Bullish]
- CMF (20): -0.049, just inside the neutral band. It peaked near +0.09 on Oct 30 but has rolled over, so buying pressure is fading and the reading is on the edge of mild distribution. [Neutral]
- ADX (14): 17.2 with +DI at 16.6 and −DI at 22.7. This is a weak, range-bound trend, though −DI is still on top, so sellers retain a slight edge. +DI spiked to 21.8 on Nov 4 but could not hold above −DI. [Weak Trend, Bearish lean]
- Volume: 50.96M, the highest in the recent window and rising on the latest large green candle. That suggests real buying interest on the bounce from the lows, but it is a single session and needs follow-through. [Bullish interpretation, unconfirmed]
DIVERGENCES & TRENDS
- Moving averages: The long-term trend is clearly down. Price is below the SMA200D ($4.86), VWAP ($4.40), EMA55 ($3.66) and SMA50D ($3.54). The SMA50D is well below the SMA200D (death cross already in place), and all of these averages are still sloping down.
- Mild bullish divergence: Price made a marginally lower low around $3.19-3.20 on Nov 3-5, but MACD stayed flat near -0.115 and has since turned up. RSI held above its September lows (around 25-30), and the Nov 6 low was not confirmed by momentum.
- MACD: Bullish crossover on Nov 6, but with both lines below zero, so it is a relief signal rather than a trend reversal.
- Momentum vs. trend: RSI jumped 12 points in one day (37.7 to 49.8). Price is testing the 21 EMA and the upper half of the Bollinger Bands, while −DI > +DI keeps a bearish undertone.
- CMF: Rolled over from positive territory to -0.049, which slightly undermines the bounce.
- Range behavior: Since late September price has traded in a tight, downward-drifting channel of roughly $3.19-$3.65, and ADX is below 20, which fits consolidation.
CHART PATTERNS
- Bearish Flag / descending channel (continuation): After the sharp drop in late August, the gently falling channel of lower highs and lower lows matches the Bearish Flag from the reference diagram. A breakdown below ~$3.19 would imply a measured move toward $2.90-$3.00.
- Bullish Falling Wedge (reversal, possible): Narrowing Bollinger Bands, a slowing rate of decline and the sharp bounce off the lower trendline hint at a falling wedge resolving upward. Confirmation requires a close above ~$3.55 (upper band and SMA50D). The target would be a retest of the EMA55 and VWAP area, $3.66 and then ~$3.90.
- Overall: The pattern evidence is mixed. The wedge/bounce has the slight edge in the near term because of the momentum turn, but the dominant trend still caps rallies.
POTENTIAL SCENARIOS
- Scenario 1: Bullish Relief Rally to the Moving Averages — The MACD crossover, the volume-backed bounce off the lower Bollinger Band and the RSI recovery lead to a mean-reversion move toward the upper band and SMA50D, then toward the EMA55. Trigger: daily close above $3.55 (upper BB/SMA50D) with CMF back above +0.05. Target: $3.55-$3.66. Invalidation: daily close below $3.19. (45% probability)
- Scenario 2: Bearish Trend Continuation — The bounce fails at the falling EMA55/SMA50D, −DI stays dominant, and price breaks the multi-week channel low as the bearish flag resolves downward. Trigger: rejection at $3.50-$3.55 followed by a close below $3.19. Target: $2.95-$3.10. Invalidation: close above $3.66. (35% probability)
- Scenario 3: Neutral Range Consolidation — Weak ADX keeps price oscillating around the 21 EMA between about $3.20 and $3.55. Trigger: failure of both breakout and breakdown with volume fading back below 40M. Target: $3.30-$3.45. Invalidation: a close outside $3.19-$3.55. (20% probability)
PRICE TARGETS
- Target Price: $3.55 (34-day)
- Expected Range: $3.12 to $3.70 (width $0.58, about 17% of current price, in line with the 30-60 day guidance)
- Key Levels: Support at $3.19, Resistance at $3.66
OVERALL BIAS
OVERALL BIAS: BULLISH - A bullish MACD crossover, a volume-backed bounce off the lower Bollinger Band, an RSI recovery to 50 and positive momentum divergence favor a relief move toward $3.55-$3.66. Conviction is modest because the long-term trend remains bearish (below SMA200D, EMA55 and VWAP, with −DI above +DI) and overhead resistance is heavy.
This is educational analysis and not financial advice.