PFE 34-day bearish forecast — Nov 8, 2026
- Bias: Bearish
- Timeframe: 34 days (made Nov 8, 2026, target date Dec 11, 2026)
- Price at analysis: $29.39
- Price target: $28.70
- Expected range: $27.10 – $31.00
- Result: Pending — graded after the close on Dec 11, 2026
Get a free AI analysis of PFE today
Analysis
TECHNICAL INDICATORS
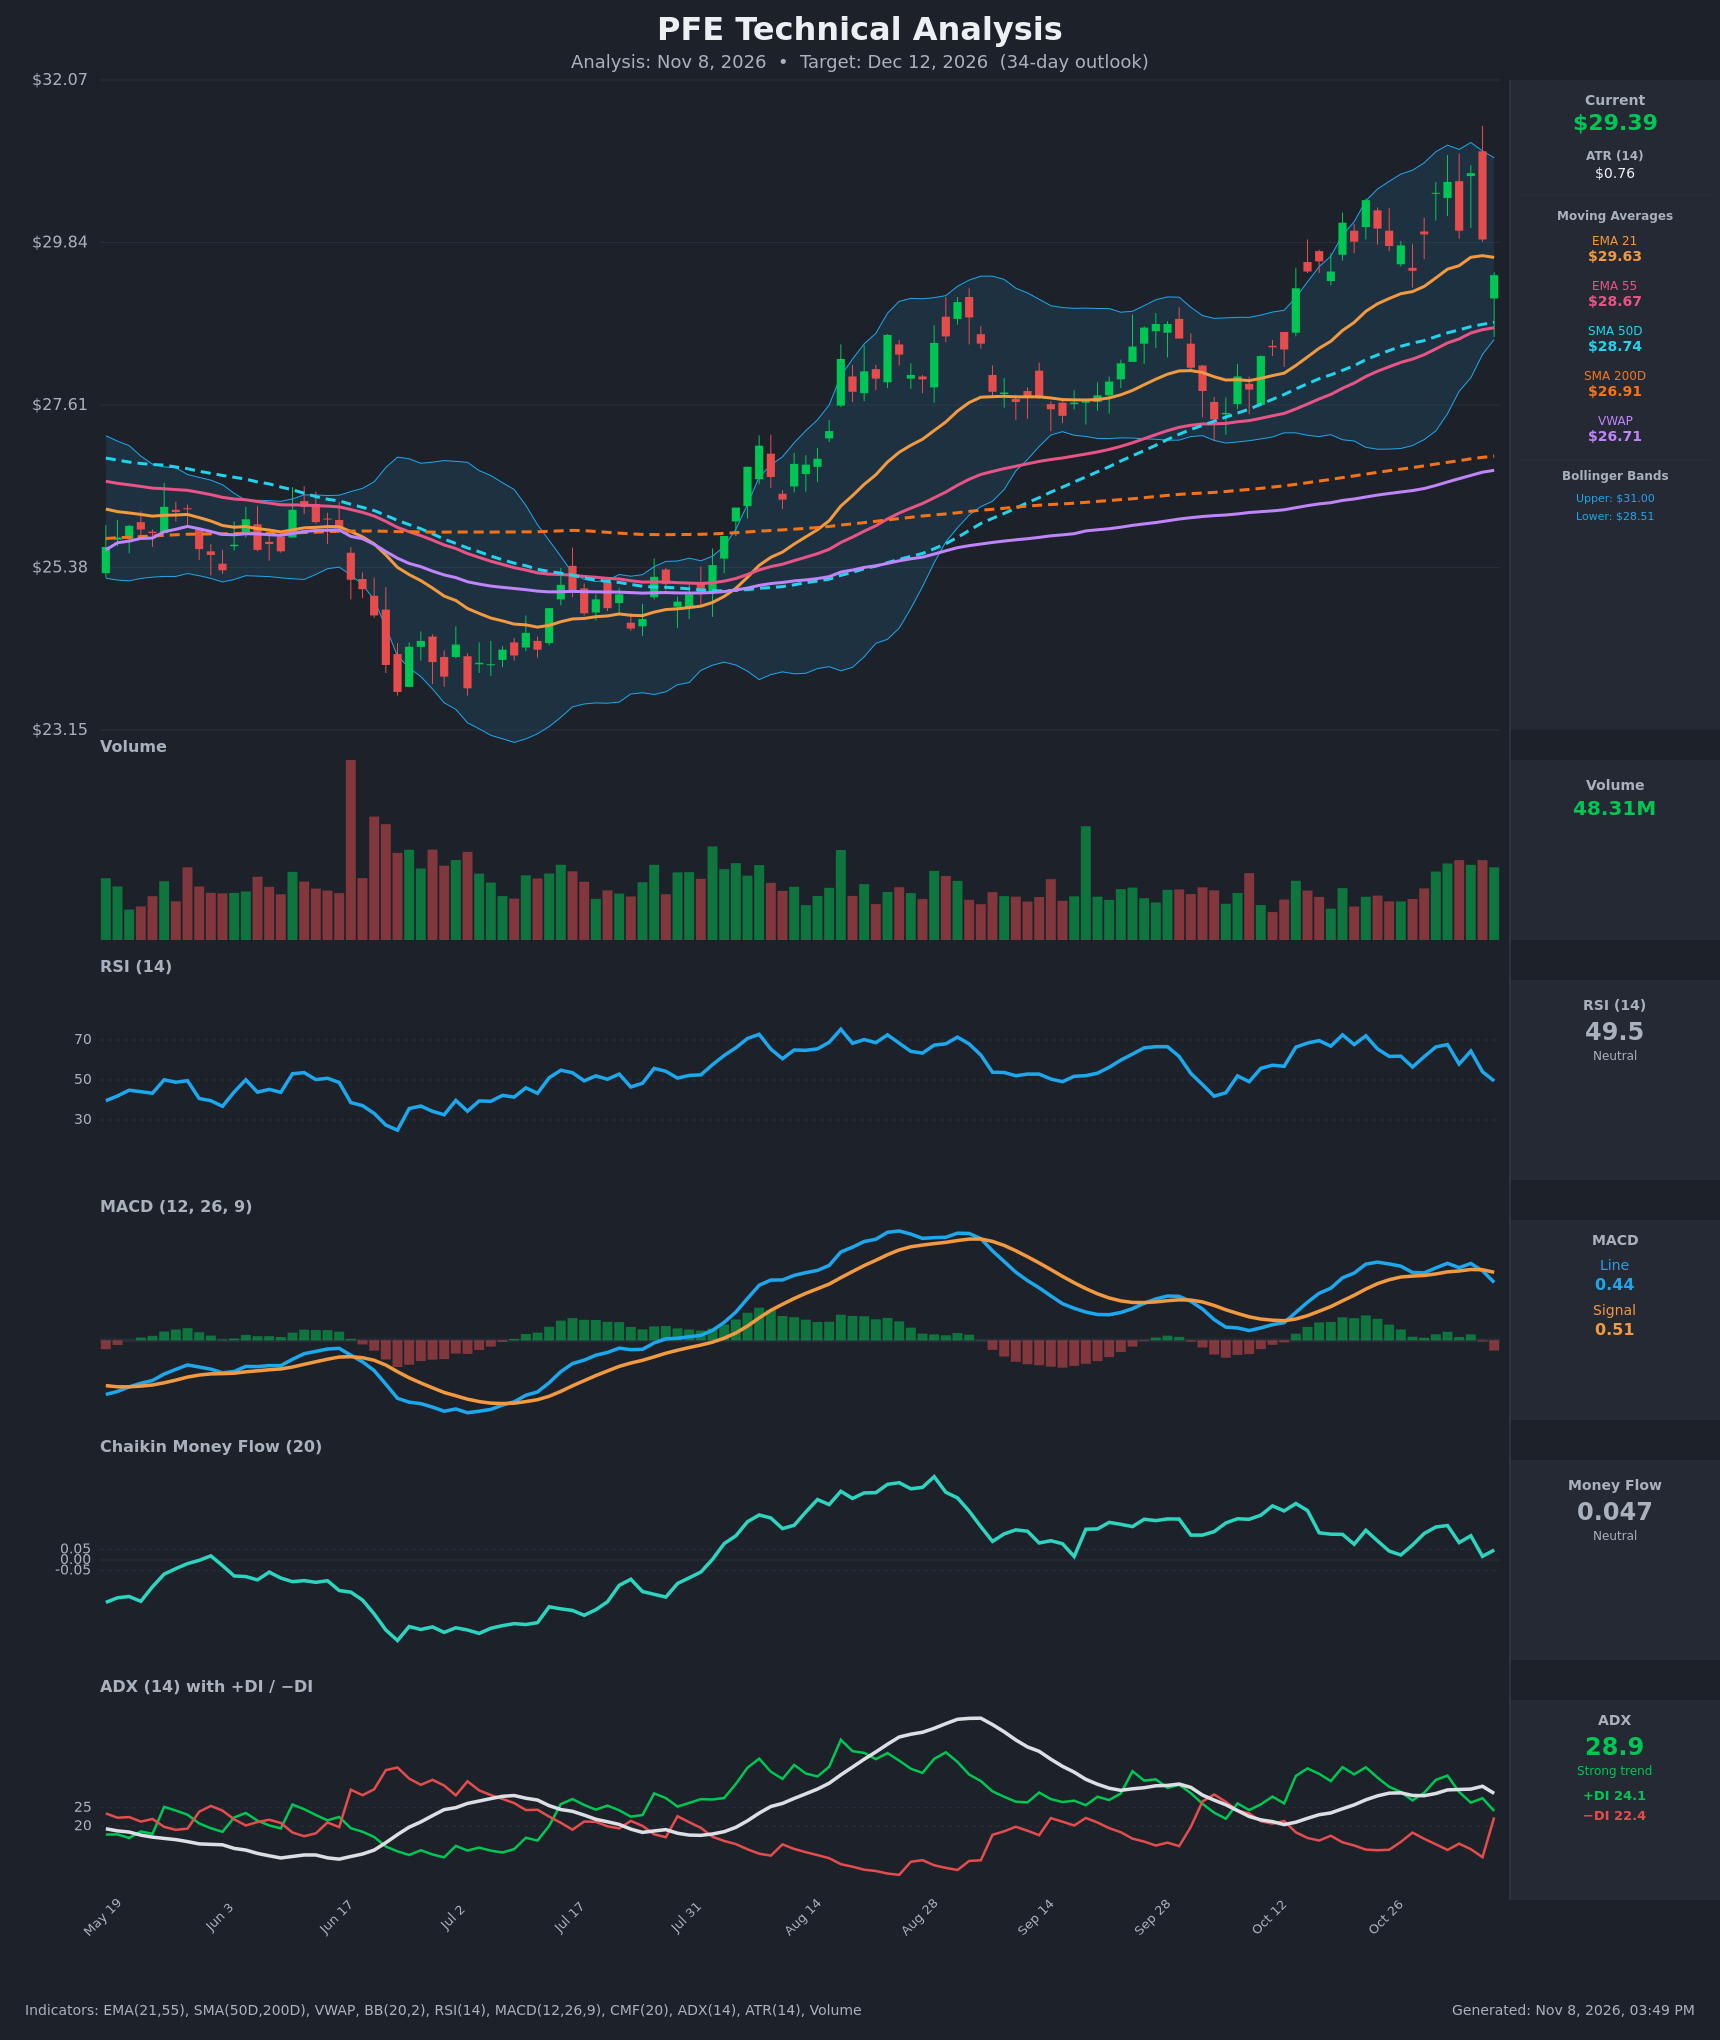
- RSI (14): 49.51, down sharply from 64.5 on Nov 4 and 72.6 on Oct 20. Momentum has fallen to the neutral midline in three sessions. It is not oversold, so there is room to fall further. [Bearish]
- 20 EMA: The provided EMA 21 is $29.63 and price ($29.39) has closed below it for the first time in this data window. The EMA is flattening (29.66 → 29.63), so it now acts as near-term resistance. EMA 21 is still well above EMA 55 ($28.67), so the broader trend structure is intact. [Bearish]
- MACD: Line 0.437 vs signal 0.514, a bearish crossover on Nov 6 (the line was above the signal on Nov 5). The histogram is negative at about -0.08 and the line is falling from 0.58. The reading is still above zero, so this is a pullback signal rather than a trend reversal. [Bearish]
- Bollinger Bands (20): Upper $31.00, lower $28.51, so the midline is about $29.76. Price is below the midline in the lower half of the bands after rejecting near the upper band at $30.79. A midline loss often leads to a test of the lower band around $28.5. [Bearish]
- CMF (20): 0.047, just under the +0.05 accumulation threshold and down from 0.164 on Nov 2. Buying pressure is fading and has slipped into neutral. [Neutral]
- ADX (14): 28.9 with +DI 24.1 and −DI 22.4. The trend is strong, but +DI has collapsed from 36 and −DI has jumped from 11.6 to 22.4 in one day. +DI is barely on top, and a bearish DI crossover is imminent. [Strong Trend, fading bullish control]
- Volume: 48.31M, among the highest of recent weeks, and it came on a pullback from the $30.79 high. Rising volume during a decline suggests active distribution. [Mildly Bearish]
DIVERGENCES & TRENDS
- Price made a higher high at $30.79 on Nov 4, but RSI peaked earlier (72.6 on Oct 20) and MACD peaked on Oct 23 (0.591). This is a mild bearish divergence between the two highs.
- CMF is trending down from 0.164 to 0.047, and +DI is falling while −DI rises. Both show buyers losing control.
- The MACD bearish crossover (Nov 6) coincides with price losing the EMA 21.
- The longer-term trend is bullish. The golden cross is already in place (SMA50 $28.74 above SMA200 $26.91), EMA 21 is above EMA 55, and price is above the 200-day and VWAP ($26.71). The MA cluster at $28.67–$28.74 is the logical pullback target.
CHART PATTERNS
- Repeated rejections at $30.4–$30.8 (Oct 22, Oct 30, Nov 2, Nov 4) resemble a Bearish Triple Top or Double Top. The neckline sits near $29.4–$29.8, and price is now at it.
- The advance from the early-October low also has the look of a rising channel/wedge, which is mildly bearish if the channel breaks.
- Pattern target: a break below $29.4 measures toward about $28.0–$28.5, roughly the pattern height of ~$1.3 subtracted from the neckline. This overlaps with the 50-day SMA, EMA 55 and lower Bollinger Band.
- A close back above $30.8 would invalidate the topping pattern and resume the uptrend.
POTENTIAL SCENARIOS
- Scenario 1: Bearish Pullback to the Moving Average Cluster — Triple-top rejection, MACD bearish cross and a DI crossover send price toward the rising 50-day SMA and EMA 55 support. Trigger: daily close below $29.00 with −DI crossing above +DI. Target: $28.50–$28.75, with an overshoot to about $27.50 possible. Invalidation: daily close above $30.00 (above the EMA 21 and Bollinger midline). (45% probability)
- Scenario 2: Bullish Trend Resumption — Price holds the $28.7 MA cluster, RSI resets near 40–45 and the uptrend resumes with a breakout over the triple-top highs. Trigger: reclaim of the EMA 21 ($29.63) and close above $30.80. Target: $31.50–$32.00. Invalidation: close below $28.50. (35% probability)
- Scenario 3: Neutral Range Consolidation — Price chops between the MA support at $28.7 and the $30.5 highs as ADX cools. Trigger: failure to break either $28.5 or $30.8. Target: $29.0–$30.0. Invalidation: decisive close outside $28.4–$30.9. (20% probability)
PRICE TARGETS
- Target Price: $28.70 (34-day horizon, a pullback of about 2.3% to the 50-day SMA/EMA 55 zone)
- Expected Range: $27.10 to $31.00 (width $3.90, about 13.3% of the current price, consistent with the 12–18% guidance for 30–60 days)
- Key Levels: Support at $28.67 (EMA 55, with the SMA50 at $28.74 and the lower Bollinger Band at $28.51 just beneath), Resistance at $30.79 (recent swing high and triple-top zone; the EMA 21 at $29.63 is nearer-term resistance)
OVERALL BIAS
OVERALL BIAS: BEARISH - The MACD bearish crossover, RSI collapse to 49.5, loss of the EMA 21, fading CMF, converging +DI/−DI and a triple-top rejection near $30.8 point to a pullback toward the $28.5–$28.75 moving-average cluster. The long-term uptrend (golden cross, price above the 200-day) should limit the downside, so the call is a modest correction rather than a trend reversal.
This is educational analysis and not financial advice.