QUBT 34-day bearish forecast — Nov 8, 2026
- Bias: Bearish
- Timeframe: 34 days (made Nov 8, 2026, target date Dec 11, 2026)
- Price at analysis: $6.33
- Price target: $6.05
- Expected range: $5.70 – $6.80
- Result: Pending — graded after the close on Dec 11, 2026
Get a free AI analysis of QUBT today
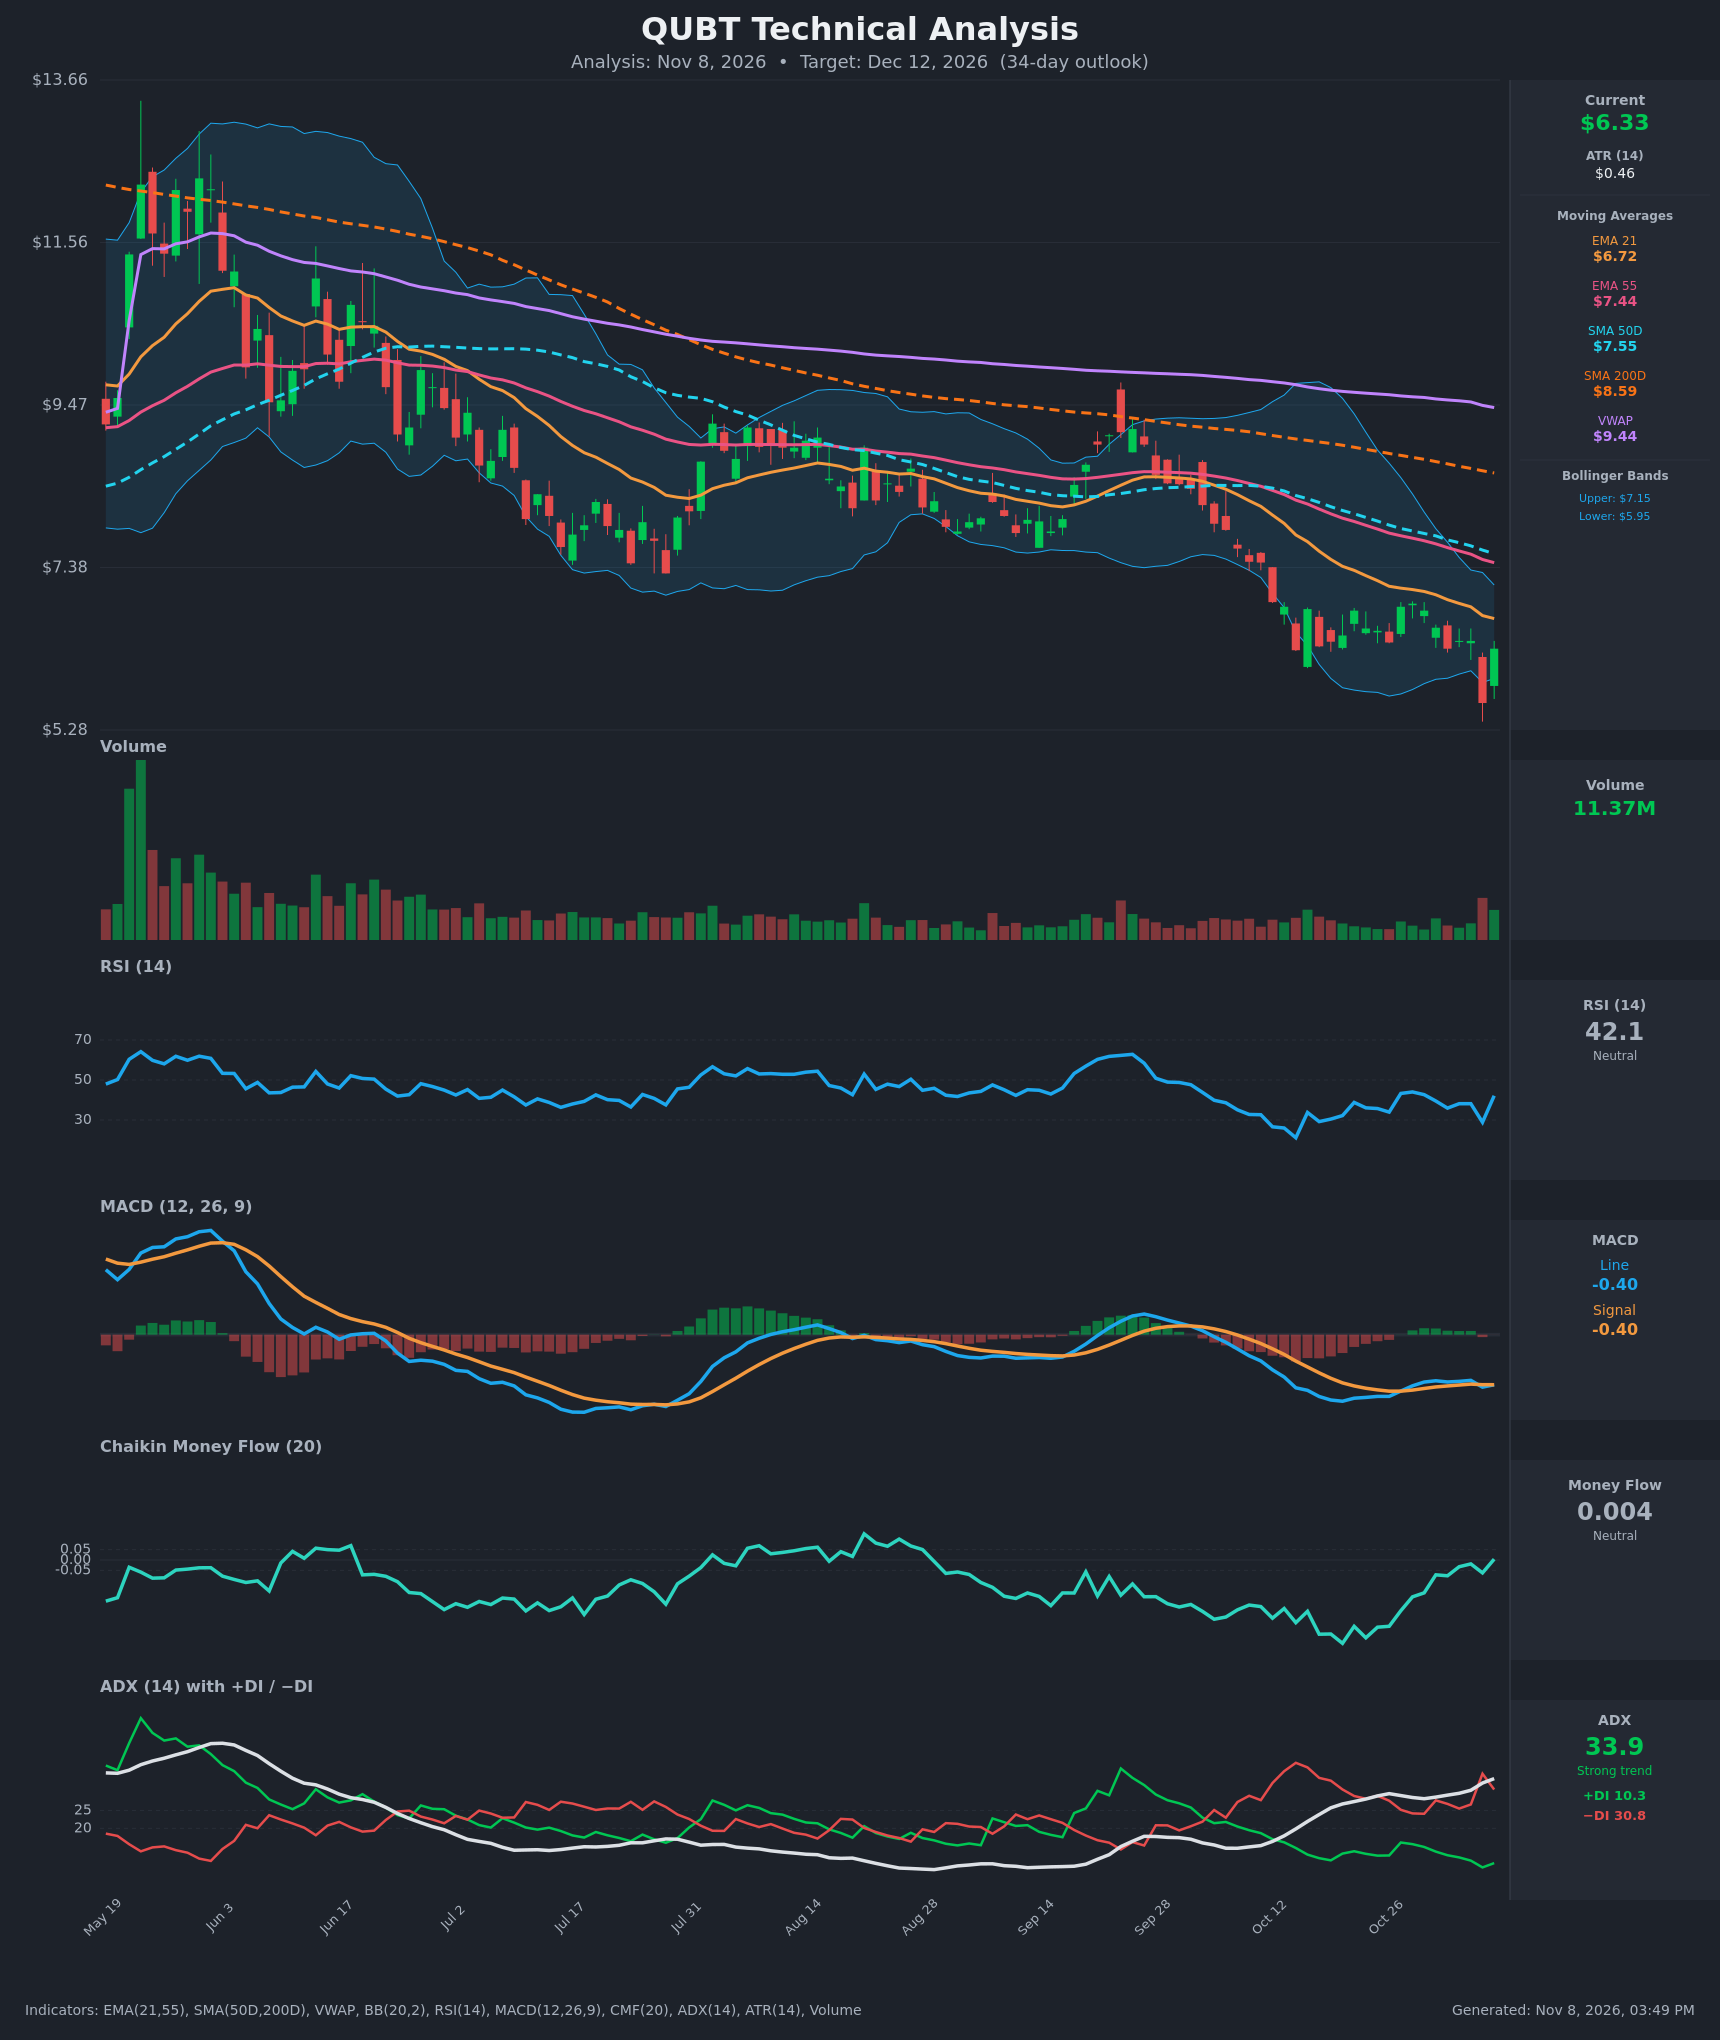
Analysis
TECHNICAL INDICATORS
- RSI (14): 42.13, bouncing from an oversold 28.9 on Nov 5 but still below 50 and under its prior lower highs. Momentum is a relief bounce inside a downtrend. [Neutral]
- 20 EMA: The EMA 21 is $6.72, above the $6.33 price, so it acts as overhead resistance. It has fallen from $7.48 to $6.72 in 15 bars, and the EMA 21 is well below the EMA 55 ($7.44). [Bearish]
- MACD: Line -0.3957 and signal -0.3953 are essentially converged, so the histogram is about zero. It is a flat, marginal bearish cross at best, and both lines sit well below zero with no bullish momentum. [Bearish]
- Bollinger Bands (20): Upper $7.15, lower $5.95, midline about $6.55. Price is below the midline and above the lower band after a Nov 5 pierce, and the bands are sloping down. This is consistent with a downtrend, with the midline as resistance. [Bearish]
- CMF (20): 0.004 sits inside the neutral band (±0.05). It has recovered from about -0.40 in mid-October, so selling pressure is easing, but there is no accumulation yet. [Neutral]
- ADX (14): 33.9 and rising, which is a strong trend. −DI (30.8) is far above +DI (10.3), so bears are firmly in control. [Strong Trend – Bearish]
- Volume: 11.37M on the Nov 6 bounce candle, following a heavy-volume red candle on Nov 5. This is a possible capitulation and bounce, but one session of buying does not confirm a reversal. [Neutral / early stabilization]
DIVERGENCES & TRENDS
- Moving-average structure: Price is below the EMA 21 ($6.72), EMA 55 ($7.44), SMA 50D ($7.55), SMA 200D ($8.59) and VWAP ($9.44). The SMA 50D is already well under the SMA 200D, so the death cross is in place and the long-term trend is down.
- Possible mild bullish divergence: The Nov 5 low of about $5.63 produced RSI 28.9, and the recent closes are reclaiming ground. CMF has also climbed from deeply negative to flat while price made lower lows. This is a weak signal that selling is fading.
- DI and ADX: −DI has stayed above +DI throughout, and ADX rose from 25.7 to 33.9. The downtrend is strengthening, not exhausting.
- MACD: The histogram has flattened toward zero after being negative. The trend is stalling, but it has not turned up.
- Rejection: The Oct 27–29 bounce toward $6.9 was rejected right at the EMA 21 and has not been retaken.
CHART PATTERNS
- Bearish Pennant / Flag (continuation): From Oct 12 to Nov 4, price consolidated in a tight $6.4–$6.9 range after a sharp drop from about $8. The Nov 5 break to $5.63 resolved it to the downside. The measured move from the flagpole points toward the low $5s.
- False-breakdown bounce: The Nov 6 recovery to $6.33 is a retest of the lower edge of the consolidation. A failure below $6.40–$6.70 would confirm the bearish continuation.
- Bullish possibility: A double-bottom-style base is only plausible if $5.63 holds and price reclaims $6.72–$6.90. That has not happened.
POTENTIAL SCENARIOS
- Scenario 1: Bearish Trend Continuation — Price fails at the EMA 21 / Bollinger midline and rolls over, with strong ADX and dominant −DI driving a retest of the Nov 5 low. Trigger: rejection at $6.55–$6.72 or a daily close below $6.00. Target: $5.60–$5.90, with an extension to $5.28 if $5.63 breaks. Invalidation: daily close above $6.90 (above the EMA 21 and the October high). (50% probability)
- Scenario 2: Neutral Choppy Basing — Capitulation volume stabilizes the price and it ranges between the Nov 5 low and the EMA 21. Trigger: holds above $5.63 and keeps closing between $5.9 and $6.7. Target: $6.00–$6.50. Invalidation: close below $5.63 or above $6.90. (28% probability)
- Scenario 3: Bullish Relief Rally — A short-covering bounce takes out the EMA 21 and the Bollinger midline, with CMF turning positive. Trigger: close above $6.72 on rising volume. Target: $7.15–$7.45 (upper band, EMA 55). Invalidation: loss of $5.95. (22% probability)
PRICE TARGETS
For the 34-day horizon (to Dec 12, 2026), the weight of evidence favors a modest further decline, with the stabilizing CMF and RSI bounce limiting the downside.
- Target Price: $6.05
- Expected Range: $5.70 to $6.80 (width $1.10, about 17.4% of current price, in line with the 12–18% guidance for 30–60 days)
- Key Levels: Support at $5.63, Resistance at $6.72
OVERALL BIAS
OVERALL BIAS: BEARISH - Price is below every major moving average, with a death cross in place, a strong and rising ADX (33.9), and −DI (30.8) far above +DI (10.3). The recent bounce is rejection-prone below the EMA 21 at $6.72, while the neutral CMF and RSI bounce argue for a modest decline to about $6.05 rather than a collapse.
This is educational analysis and not financial advice.