PFE 55-day bullish forecast — Nov 8, 2026
- Bias: Bullish
- Timeframe: 55 days (made Nov 8, 2026, target date Jan 1, 2027)
- Price at analysis: $29.39
- Price target: $29.90
- Expected range: $27.30 – $31.60
- Result: Pending — graded after the close on Jan 1, 2027
Get a free AI analysis of PFE today
Analysis
TECHNICAL INDICATORS
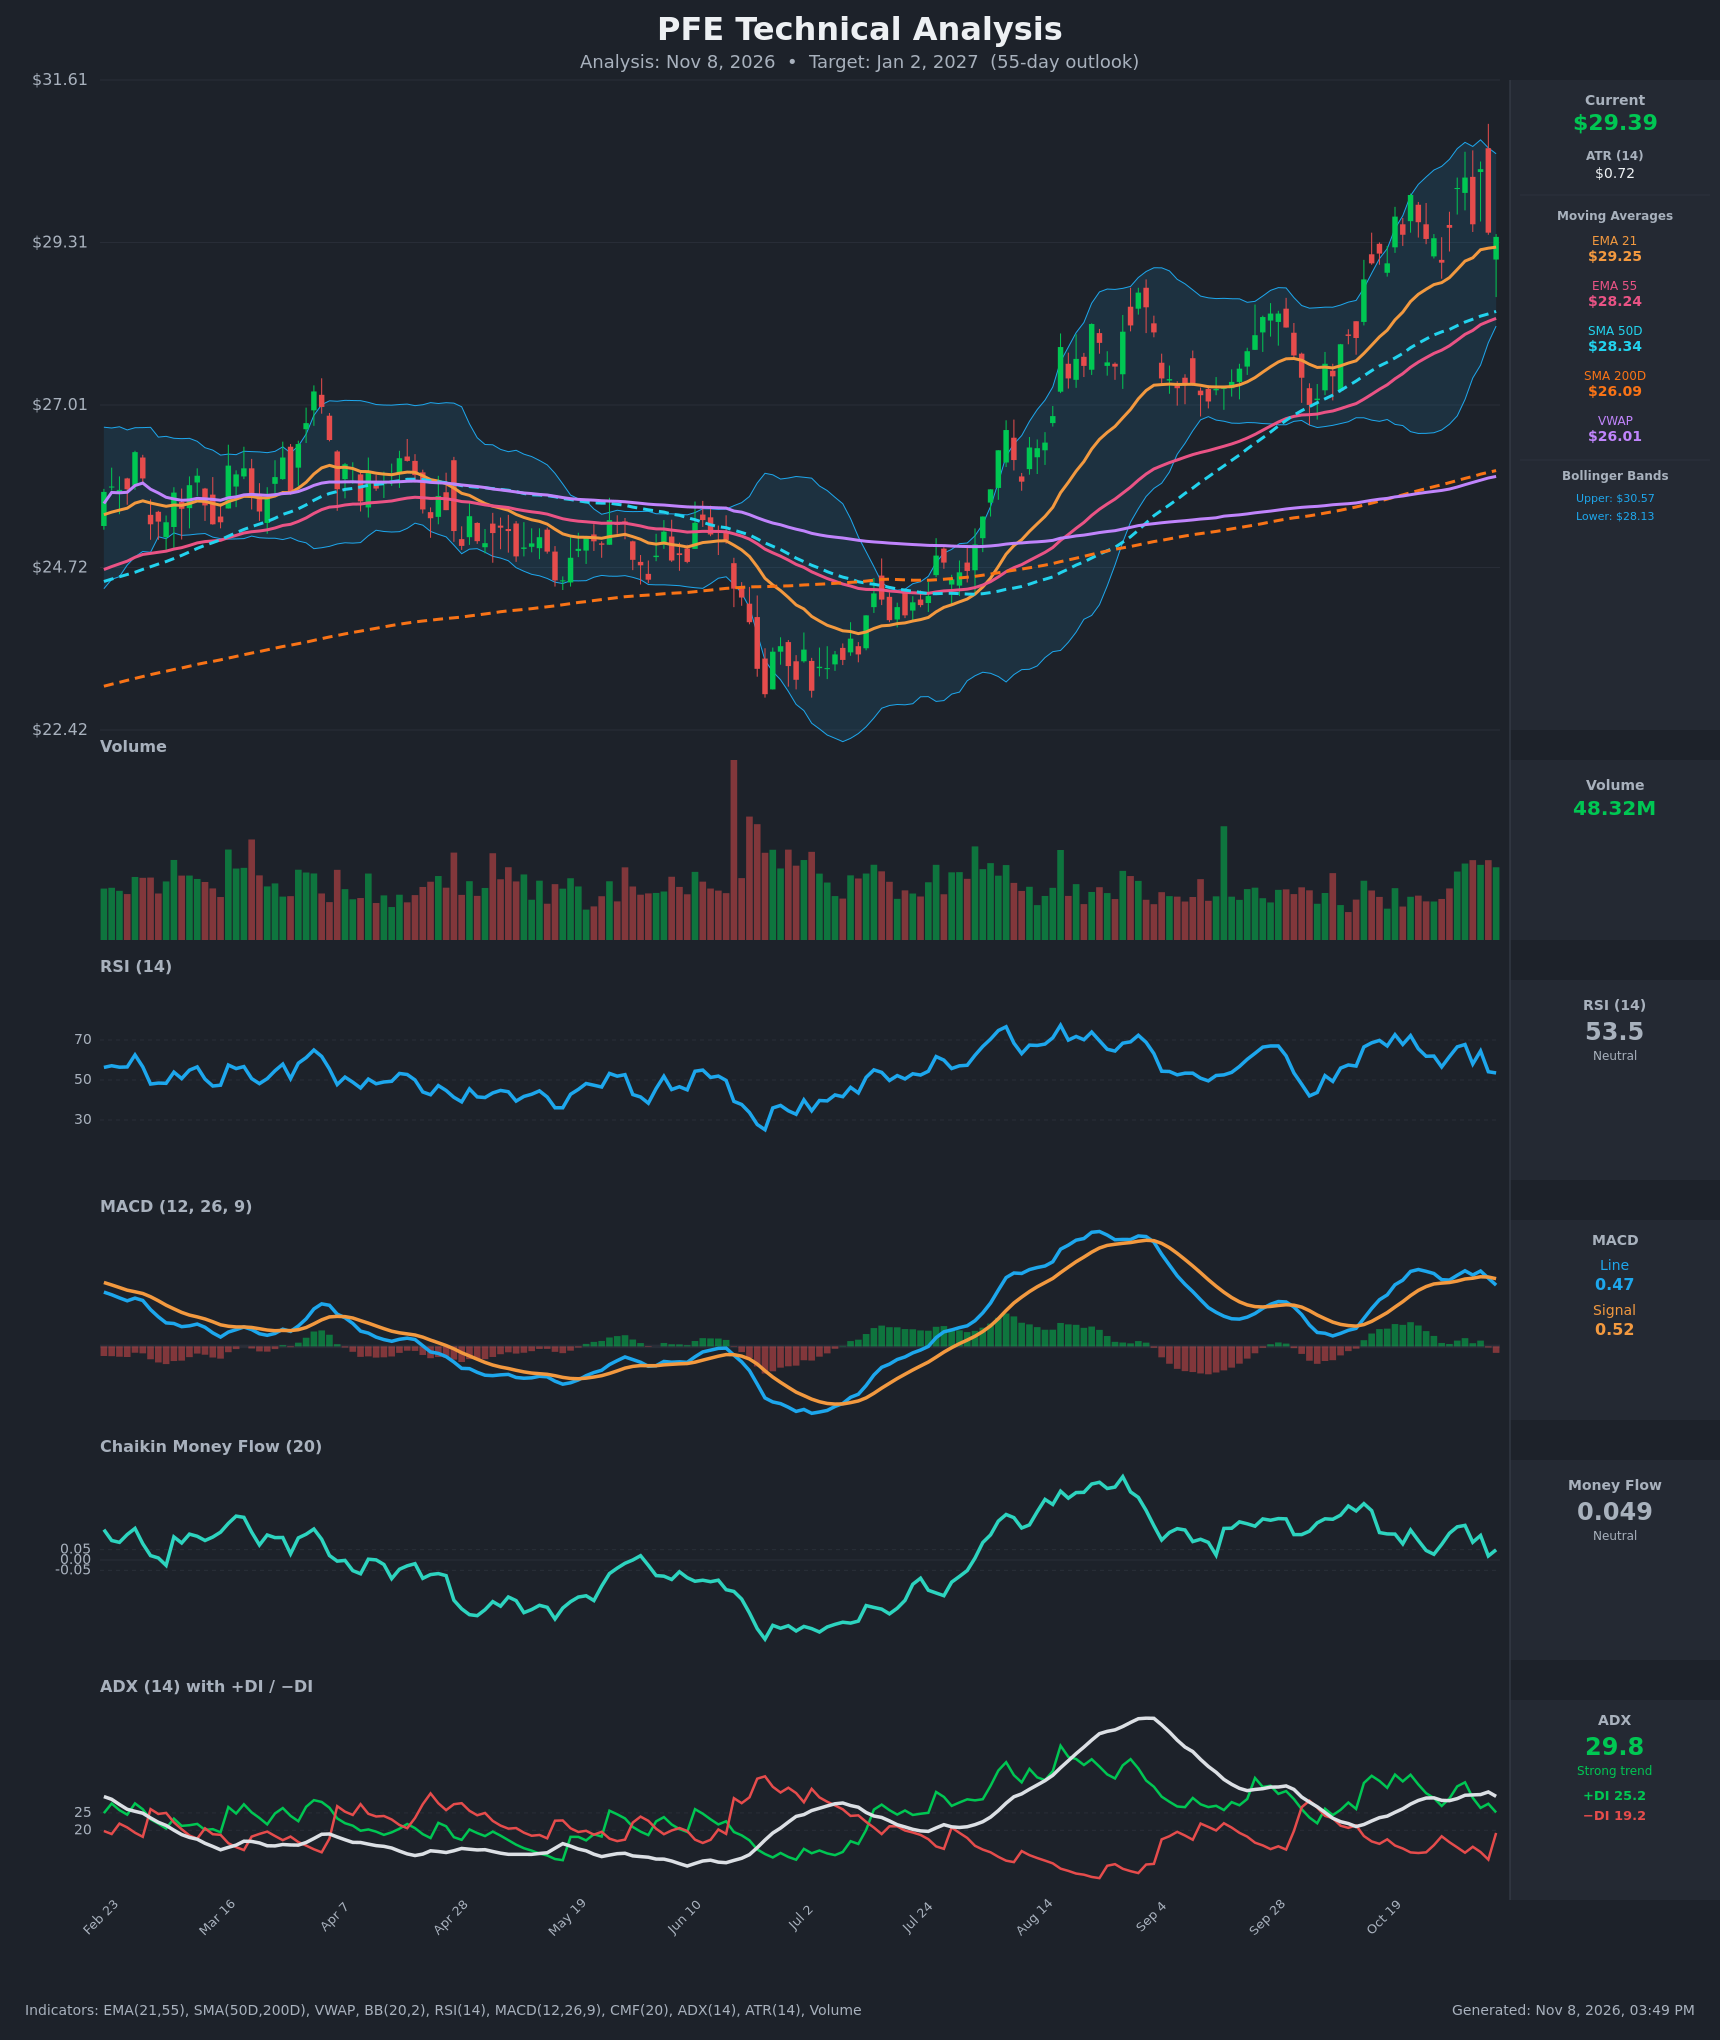
- RSI (14): 53.52, down sharply from 72.7 on Oct 20 and 67.7 on Nov 2. It is back near the neutral 50 line with falling momentum, and it has cooled without becoming oversold. [Neutral]
- 20 EMA: EMA21 is $29.25 and price ($29.39) sits just above it. EMA21 is above EMA55 ($28.24) and still rising, so it acts as first support. The Nov 5 close at $29.45 held it, but only just. [Bullish]
- MACD: The line (0.466) crossed below the signal (0.515) on Nov 5-6, and the histogram has flipped slightly negative. Both lines are still positive and well above zero, so this looks like a momentum pause inside an uptrend rather than a trend reversal. [Bearish]
- Bollinger Bands (20): The upper band is $30.57, the lower $28.13 and the midline about $29.35. Price is pinned at the midline after rejecting the upper band at $30.35 on Nov 4. The bands are still wide from the rally, so volatility is elevated but not expanding further. [Neutral]
- CMF (20): 0.049, just under the +0.05 accumulation threshold. It has faded from 0.167 on Nov 2 and touched 0.019 on Nov 5. Buying pressure is weakening but has not turned into distribution. [Neutral]
- ADX (14): 29.8, a strong trend. +DI (25.2) is above −DI (19.2), so bulls still control. However, +DI has fallen from 36 while −DI has jumped from 11.6 to 19.2 in two sessions, so the trend is losing directional dominance. [Strong Trend + Bullish, weakening]
- Volume: 48.32M, among the heavier readings of the last few months. Volume rose during the October advance, which confirms the rally. The red candle on Nov 5 came on solid volume and shows some supply near $30. [Neutral to mildly Bullish]
DIVERGENCES & TRENDS
- Momentum divergence: Price made a slightly higher high at $30.35 on Nov 4 versus $30.23 on Nov 2, but RSI (64.5 vs 67.7) and MACD (0.573 vs 0.575) did not confirm. This is a minor bearish divergence.
- MA structure: SMA50D ($28.34) is above SMA200D ($26.09), so the golden cross is already in place. EMA21 > EMA55 > SMA50D > SMA200D, and price is above VWAP ($26.01). This is a fully bullish long-term alignment, and the gap above VWAP shows an extended price.
- MACD: The bearish crossover is fresh. The earlier crossover in September produced a deeper pullback before the rally resumed.
- DI spread: The +DI/−DI gap has narrowed from about 22 points to 6, a warning that the pullback may continue before the trend resumes.
- CMF: Still positive but trending down from its October levels.
CHART PATTERNS
- Possible Bearish Double/Triple Top (~$30.1-$30.35): Highs on Oct 30, Nov 2 and Nov 4 were rejected at nearly the same level. A confirmed break below the neckline at about $28.9-$29.0 would measure roughly $1.3 lower, to around $27.6-$27.7. This is not yet confirmed.
- Rising channel / bullish continuation: The larger structure is a steady advance from the July low (~$23) with higher highs and higher lows. A pullback toward EMA55/SMA50 (~$28.2-$28.3) would fit a bullish flag/pullback. A breakout above $30.35 projects toward $31.5-$32.
- Net read: The larger trend is up, while the short-term top formation is only a risk until the neckline breaks.
POTENTIAL SCENARIOS
- Scenario 1: Bullish Pullback and Trend Resumption — Price retests the EMA55/SMA50 zone near $28.2-$28.4, then resumes the uptrend as the MA stack and golden cross keep buyers engaged. Trigger: a bounce off $28.2-$28.4 with MACD re-crossing up and RSI holding above 45. Target: $30.35 retest, then $31.50. Invalidation: daily close below $28.00. (45% probability)
- Scenario 2: Neutral Consolidation — Price chops between the Nov highs and the 50-day average as the MACD reset runs its course. Trigger: ADX rolls over below 25 with price oscillating around the 21 EMA. Target: $28.30-$30.30 range. Invalidation: close above $30.60 or below $28.00. (30% probability)
- Scenario 3: Bearish Double/Triple Top Breakdown — The failed highs near $30.3 and the rising −DI lead to a breakdown. Trigger: close below $28.90, then below $28.13 (lower Bollinger Band and EMA55 area). Target: $27.60, then SMA200D at $26.09. Invalidation: close back above $30.35. (25% probability)
PRICE TARGETS
- Target Price: $29.90 (55-day horizon, to about Jan 2, 2027)
- Expected Range: $27.30 to $31.60 (width $4.30, about 14.6% of the current price, within the 12-18% guidance for 30-60 days)
- Key Levels: Support at $28.24 (EMA55, with SMA50D just above at $28.34), Resistance at $30.35 (recent triple-top highs)
OVERALL BIAS
OVERALL BIAS: BULLISH - The long-term structure (golden cross, price above all major MAs and VWAP, ADX near 30 with +DI on top) outweighs the short-term MACD cross, fading RSI and tops near $30.35. Expect a possible pullback toward $28.2-$28.4 before the uptrend resumes. Conviction is modest, and a close below $28.00 would flip the view.
This is educational analysis and not financial advice.