SLV 55-day bearish forecast — Nov 8, 2026
- Bias: Bearish
- Timeframe: 55 days (made Nov 8, 2026, target date Jan 1, 2027)
- Price at analysis: $46.87
- Price target: $45.00
- Expected range: $39.50 – $48.00
- Result: Pending — graded after the close on Jan 1, 2027
Get a free AI analysis of SLV today
Analysis
TECHNICAL INDICATORS
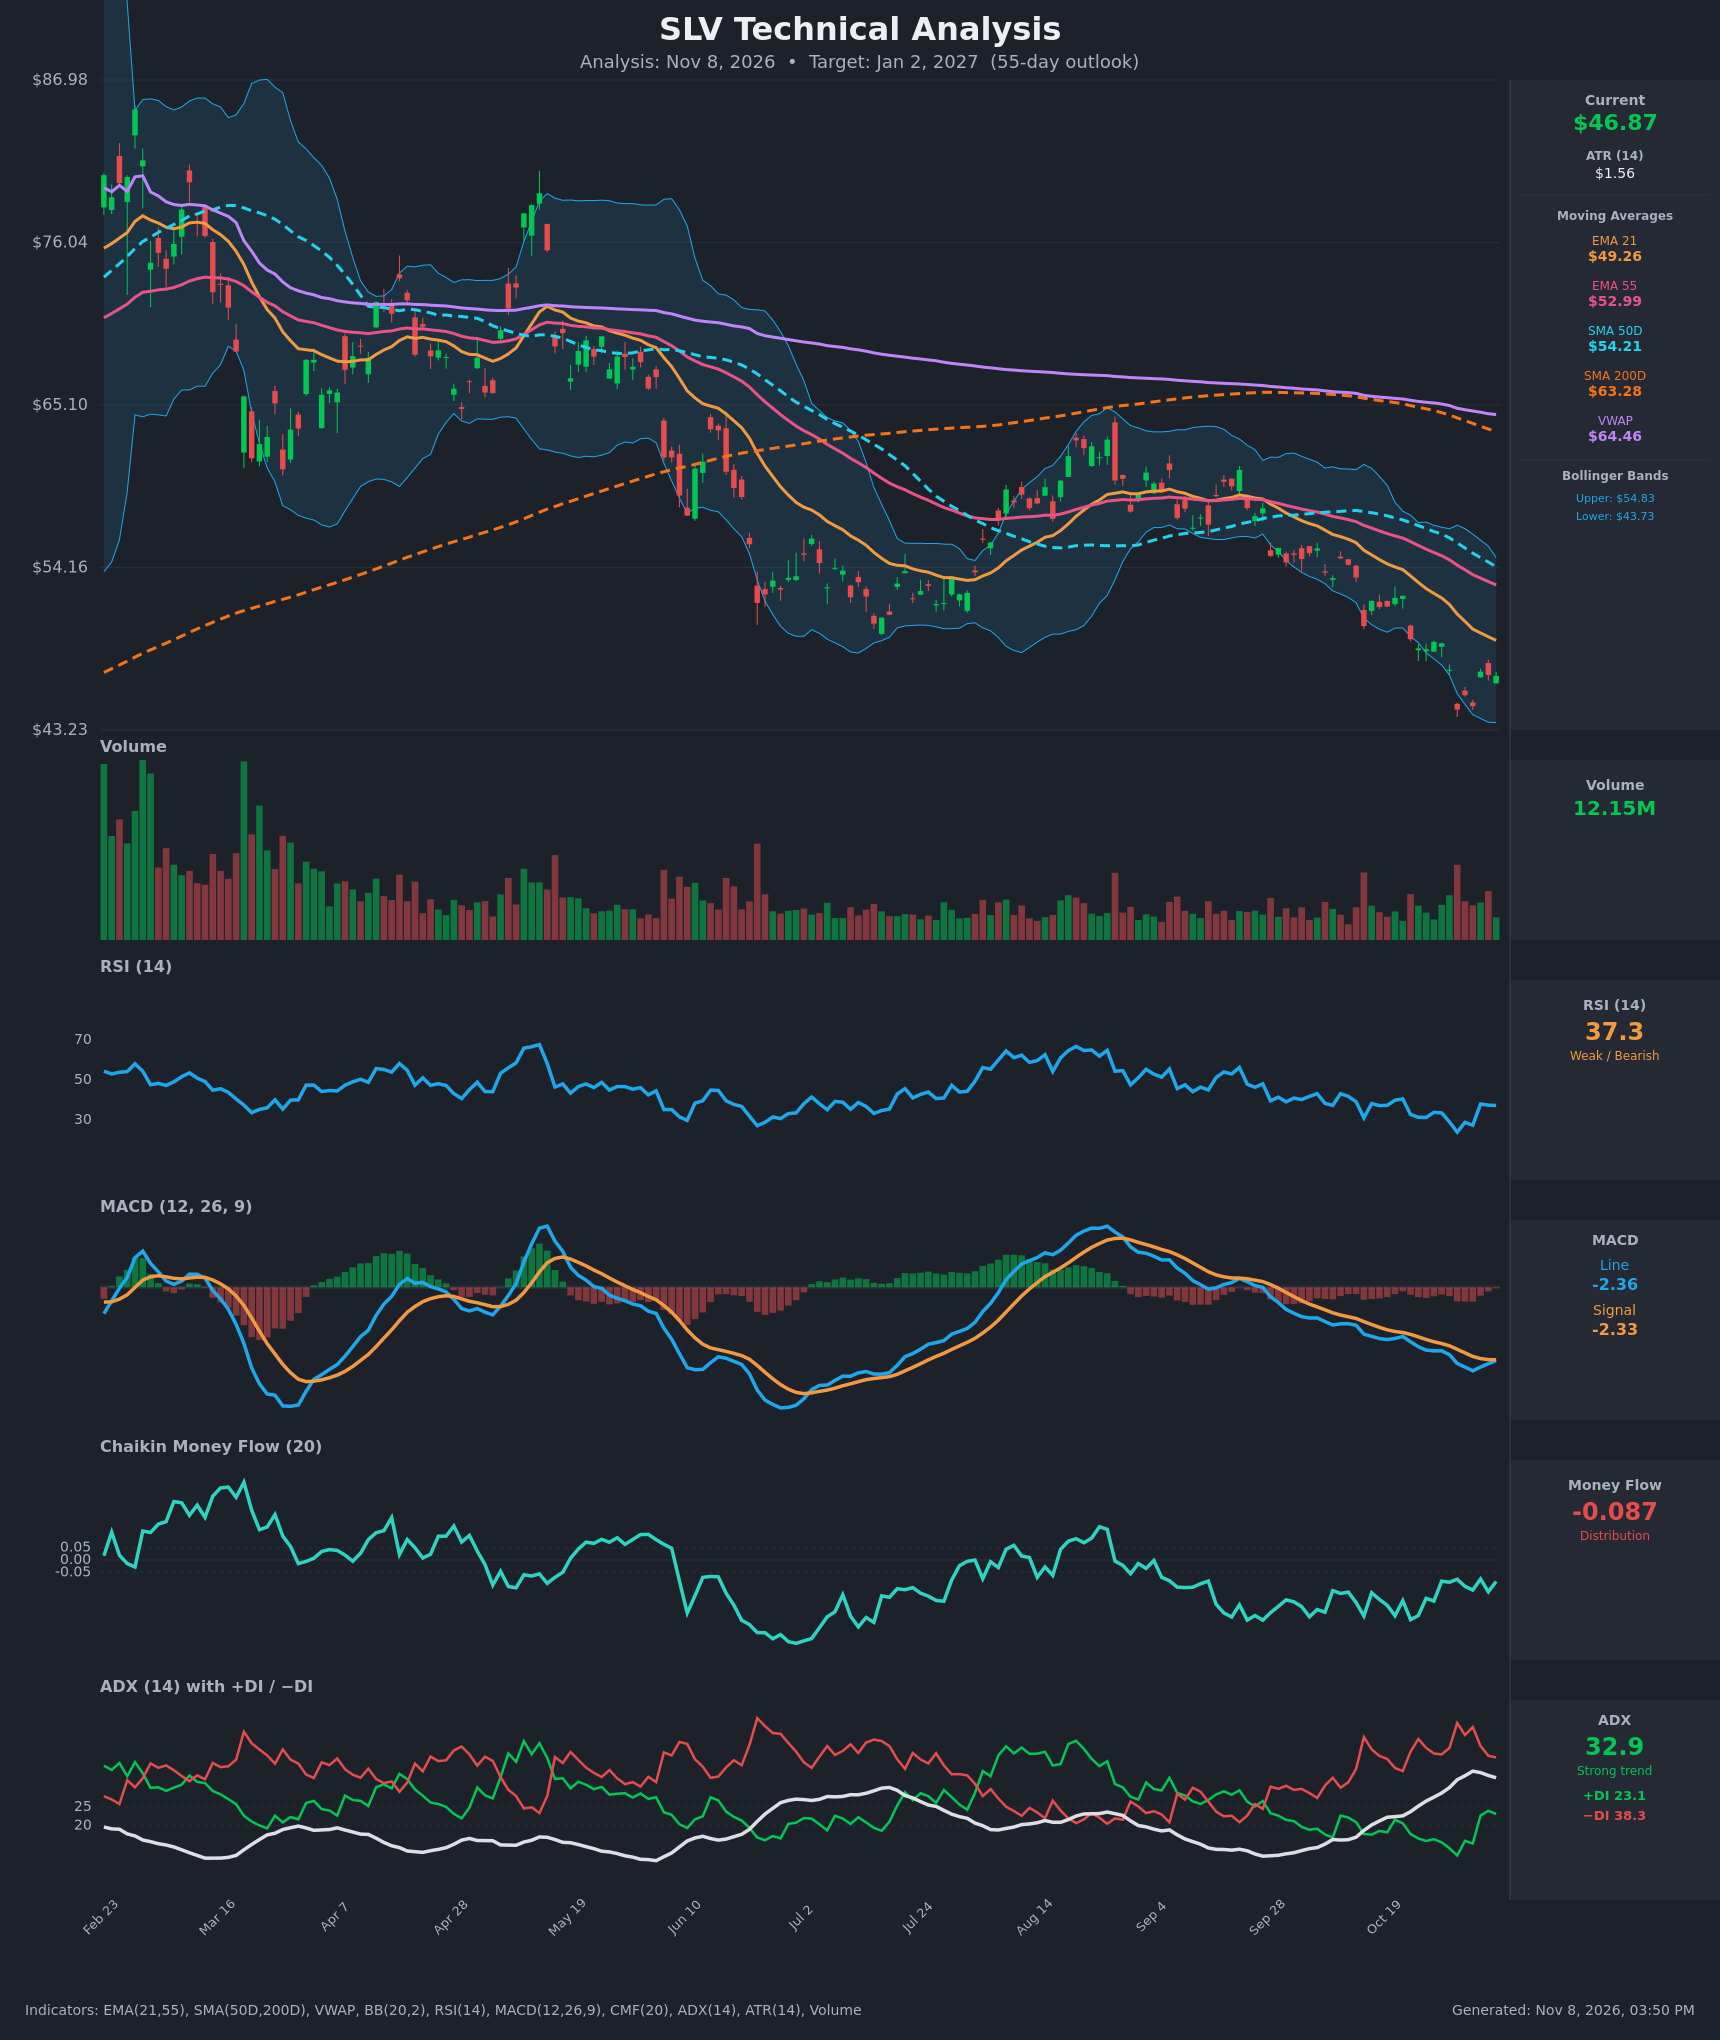
- RSI (14): 37.26. It bounced from 23.9 on Oct 30, but it remains below 40 and has not reclaimed 50. Momentum is weak and still in bearish territory, with only a modest oversold relief bounce. [Bearish]
- 20 EMA (EMA 21): $49.26, with price at $46.87 about 4.9% below it. EMA 21 is below EMA 55 ($52.99) and sloping down, so it acts as overhead resistance. [Bearish]
- MACD: Line -2.355 vs signal -2.334. The line has been below the signal since early Oct, but the gap is now only about 0.02, and the line is rising from -2.689. A bullish crossover is close, but it would occur deep below zero. Momentum is negative but stabilizing. [Neutral]
- Bollinger Bands (20): Upper $54.83, lower $43.73, middle about $49.28. Price is in the lower half, about 28% of the band width above the lower band, after a touch of the lower band near $44.6 on Oct 30. The bands are wide and the SMA 50D is falling. Price is walking down the lower half, which signals a downtrend. [Bearish]
- CMF (20): -0.087, below -0.05 and negative for most of the past several months. It improved slightly from -0.24, but it is still distribution. [Distribution]
- ADX (14): 32.9, above 25 but slightly off its peak of 34.6. −DI at 38.3 is well above +DI at 23.1. This is a strong downtrend, though the trend strength is starting to roll over. [Strong Trend – Bearish]
- Volume: 12.15M, moderate. There was a volume spike on the Oct 30 capitulation drop and the following bounce, but no clear sign of climactic exhaustion. Volume is average on the declines, which is consistent with orderly selling. [Neutral to mildly Bearish]
- Moving averages and VWAP: Price is below EMA 21 ($49.26), EMA 55 ($52.99), SMA 50D ($54.22), SMA 200D ($63.28) and VWAP ($64.46). The SMA 50D is below the SMA 200D, a death cross that has been in place for months. The MA stack is fully bearish. [Bearish]
DIVERGENCES & TRENDS
- No bullish price/RSI divergence yet. Price made a new low at about $44.60 on Oct 30 and a higher-low area near $44.84 on Nov 3. RSI also made a higher low (23.9 to 27.4), a mild positive momentum divergence that suggests selling pressure is easing.
- MACD is converging on its signal line and the histogram is nearly flat. A bullish cross may occur soon, but it would be a weak signal below zero in a strong downtrend.
- ADX is above 30, having peaked around 34.6, with −DI dominant. +DI has recovered from 12 to 23, so the bears are losing some steam.
- Moving averages are stacked bearishly (EMA 21 < EMA 55 < SMA 50D < SMA 200D < VWAP) and all are falling. Each bounce since the August high near $65 has failed at the EMA 21 or EMA 55.
- CMF has stayed below zero since June apart from brief positive spikes in August and has not confirmed any rally.
CHART PATTERNS
- Primary pattern: a persistent downtrend of lower highs and lower lows (from about $87 in February to $46.87), with a possible Bearish Rising Wedge/Bearish Flag-type structure on the Aug–Sep bounce that resolved downward. The break below the $54–55 area (Sep support) confirmed continuation. The measured move of that consolidation points toward the $44–46 area, which has already been reached.
- Possible Bullish Falling Wedge or Double Bottom forming at $44.6–$44.8. The Oct 30 and Nov 3 lows are nearly equal, with RSI making a higher low. A Double Bottom confirms only on a break above the neckline at about $47.2–$49 (the Nov 4 high of about $47.2 and EMA 21 at $49.26). The neckline target would be roughly $50–$51. This is not confirmed.
- Overall: the dominant structure is a bearish continuation, with the double bottom a speculative counter-case.
POTENTIAL SCENARIOS
- Scenario 1: Bearish Trend Continuation — Price fails at EMA 21 (about $49) and breaks below the $44.60 low, with −DI still dominant and CMF in distribution. Trigger: daily close below $44.60. Target: $40.50–$42.00. Invalidation: daily close above $50.50. (45% probability)
- Scenario 2: Neutral/Choppy Base — Price holds the $44.60 low and ranges between $44 and $50, with the MACD cross and RSI recovery limited by overhead EMA 21 resistance. Trigger: holds $44.60 with closes between $45 and $49. Target: $46–$48. Invalidation: close below $44.00 or above $50.50. (25% probability)
- Scenario 3: Bullish Double-Bottom Relief Rally — A MACD bullish cross and RSI above 45 push price through the $47.2 neckline and EMA 21. Trigger: close above $49.30 on rising volume. Target: $52.00–$53.00 (EMA 55 area). Invalidation: close back below $45.00. (30% probability)
PRICE TARGETS
For a 55-day horizon (30-60 day guidance of ~12-18% range width), the evidence tilts bearish: a full MA stack is above price, ADX is strong with −DI dominant, and CMF shows distribution. The oversold bounce potential keeps the target only modestly below the current price.
- Target Price: $45.00 (about -4% from $46.87)
- Expected Range: $39.50 to $48.00 (width of $8.50, or about 18.1% of the current price, within the 12-18% guidance after rounding)
- Key Levels: Support at $44.60, Resistance at $49.26
OVERALL BIAS
OVERALL BIAS: BEARISH - Price is below every moving average and VWAP, with a death cross in place, ADX at 32.9 with −DI far above +DI, and CMF in distribution. The bounce from the Oct 30 oversold low is likely to meet resistance at EMA 21 (about $49.26), though a MACD cross and a possible double bottom keep relief-rally risk meaningful.
This is educational analysis and not financial advice.