ARM 55-day bearish forecast — Nov 8, 2026
- Bias: Bearish
- Timeframe: 55 days (made Nov 8, 2026, target date Jan 1, 2027)
- Price at analysis: $174.62
- Price target: $162.00
- Expected range: $149.00 – $180.00
- Result: Pending — graded after the close on Jan 1, 2027
Get a free AI analysis of ARM today
Analysis
TECHNICAL INDICATORS
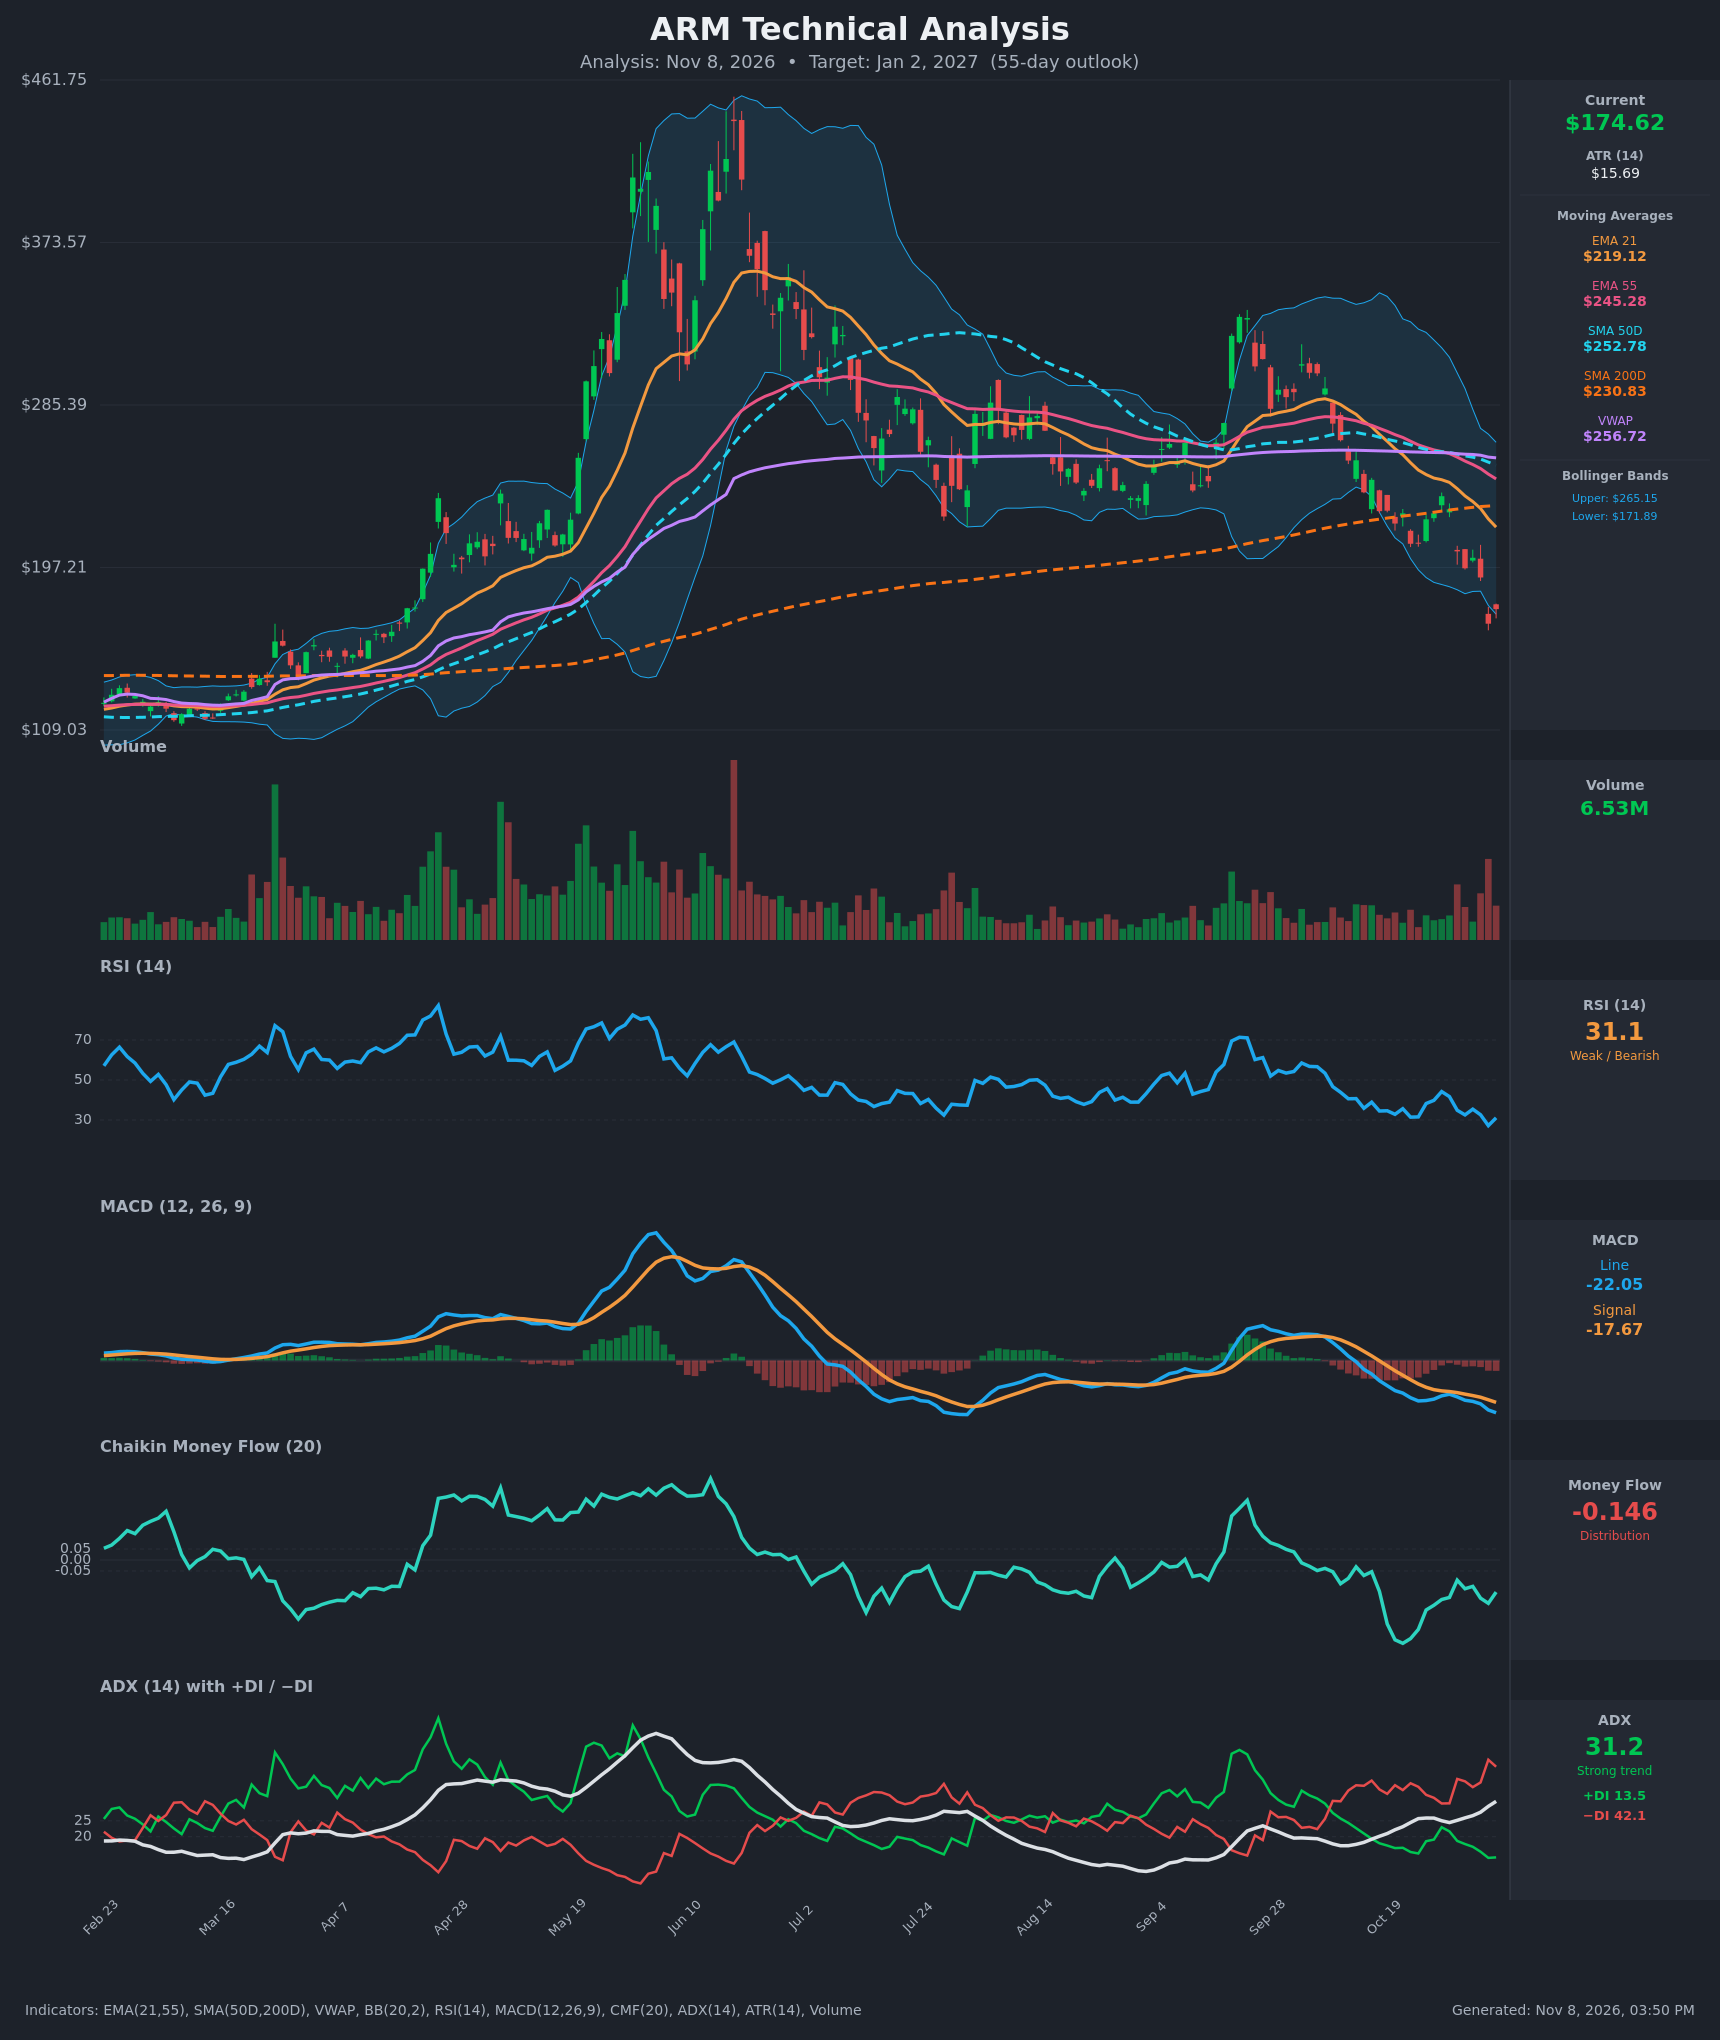
- RSI (14): 31.08, just above oversold. It made a low of 27.2 on Nov 5 and has bounced slightly. It has stayed below 50 since late September and keeps making lower highs, so momentum is weak, with only a marginal oversold bounce. [Bearish]
- 20 EMA (EMA 21): $219.12, about 25% above price. Price has been below it for weeks, and the EMA is falling steeply (265.70 to 219.12 in 15 bars). It is dynamic resistance, and the EMA21 is also well below the EMA55 ($245.28). [Bearish]
- MACD: Line -22.05 is below signal -17.67, and the gap is widening (-2.24 to -22.05 over 15 bars). The histogram is negative and expanding, and the line is making new lows. There is no bullish crossover. [Bearish]
- Bollinger Bands (20): Price at $174.62 is just above the lower band ($171.89), after closing at $166.72 on Nov 5, which was likely a close below the band. The bands are wide (upper $265.15), so volatility is elevated. Walking the lower band in a strong downtrend is bearish, though stretched conditions raise the odds of a relief bounce. [Bearish]
- CMF (20): -0.146, well below -0.05. It has been negative for most of the period and dipped to roughly -0.38 in late October. The recent improvement to -0.09 faded again, so distribution persists. [Distribution]
- ADX (14): 31.2 and rising (21 to 31 in 15 bars). −DI at 42.1 is far above +DI at 13.5, which shows a strong, bear-controlled trend with no sign of a DI crossover. [Strong Trend – Bearish]
- Volume: 6.53M, moderate and below the spikes seen during the Nov 5 selloff. There were heavy red volume bars on the drop and no capitulation-scale spike yet. Sellers have been dominant, and the bounce so far lacks volume confirmation. [Bearish / lacks bounce confirmation]
Other trend context:
- Price is below SMA200D ($230.83), VWAP ($256.72), SMA50D ($252.78) and both EMAs, so every major average is overhead resistance.
- The SMA50D is falling toward the SMA200D, and a death cross is approaching within weeks if the decline continues.
DIVERGENCES & TRENDS
- No bullish divergence yet. Price made a new low at $166.72 on Nov 5, and RSI (27.2) also made a lower low versus the Oct 22–23 lows (~31). The indicators confirm the price weakness.
- Trend in indicators: MACD, CMF and RSI are all trending lower, while ADX and −DI are rising. This is a classic confirmed downtrend.
- Crossovers and breaks:
- Price broke below the SMA200D in late October.
- EMA21 is below EMA55.
- MACD is below its signal line.
- The SMA50D/SMA200D death cross is imminent but not yet confirmed.
- Oversold caveat: RSI near 30 and price at the lower Bollinger Band make a relief bounce toward $195–$220 plausible. Those levels would likely be sold into.
CHART PATTERNS
- Broad bearish structure (resembles a Bearish Head and Shoulders / Double Top at the macro scale): The June peak (~$440) was followed by a lower high in September (~$330), then a break of the August–October support area (~$225–$230) and the SMA200D. The measured downside of this reversal points toward the $110–$150 zone over time.
- Descending channel of lower highs and lower lows: This is like the reference diagram's bearish continuation patterns (a Bearish Flag after the Oct 30 and Nov 5 breakdowns). The Nov 6 bounce is a potential flag, and a break below $166.72 would project roughly to $140–$150 (the prior leg of ~$30–$40 measured down).
- Support reference: The February–April consolidation area (~$110–$140) is the major base below.
POTENTIAL SCENARIOS
- Scenario 1: Bearish Trend Continuation — A weak bounce fails at the falling EMA21 or the $190–$200 area, and sellers push price through the Nov 5 low. ADX keeps rising with −DI dominant and a death cross forms. Trigger: close below $166.72. Target: $145–$160. Invalidation: daily close above $200 with MACD turning up. (50% probability)
- Scenario 2: Bullish Oversold Relief Rally — RSI at about 30 and price at the lower Bollinger Band produce a mean-reversion bounce toward the EMA21 ($219) that eventually stalls under the SMA200D and EMA55. Trigger: close above $191.80 on rising volume. Target: $200–$220. Invalidation: loss of $166.72. (35% probability)
- Scenario 3: Neutral Base Building — Price chops between $160 and $195 as selling exhausts and ADX rolls over. Trigger: failure to make new lows with CMF rising above -0.05. Target: $165–$190. Invalidation: close outside $155–$200. (15% probability)
PRICE TARGETS
For the 55-day horizon (to about Jan 2, 2027), the evidence favors a continuation lower, with a bounce along the way. The ATR of $15.69 and the elevated volatility argue for a wide range.
- Target Price: $162.00
- Expected Range: $149.00 to $180.00 (width $31, about 17.8% of current price, consistent with the 30–60 day guidance of 12–18%)
- Key Levels: Support at $166.72 (Nov 5 low), Resistance at $191.80 (Nov 4 close and breakdown area)
OVERALL BIAS
OVERALL BIAS: BEARISH - Price sits below every major moving average and the SMA200D. MACD is bearish and widening, CMF shows distribution, and ADX at 31 with −DI at 42 vs +DI at 13.5 confirms a strong downtrend. An oversold bounce is possible, but the trend evidence outweighs it.
This is educational analysis and not financial advice.