GLD 55-day bearish forecast — Nov 8, 2026
- Bias: Bearish
- Timeframe: 55 days (made Nov 8, 2026, target date Jan 1, 2027)
- Price at analysis: $372.52
- Price target: $364.00
- Expected range: $340.00 – $398.00
- Result: Pending — graded after the close on Jan 1, 2027
Get a free AI analysis of GLD today
Analysis
TECHNICAL INDICATORS
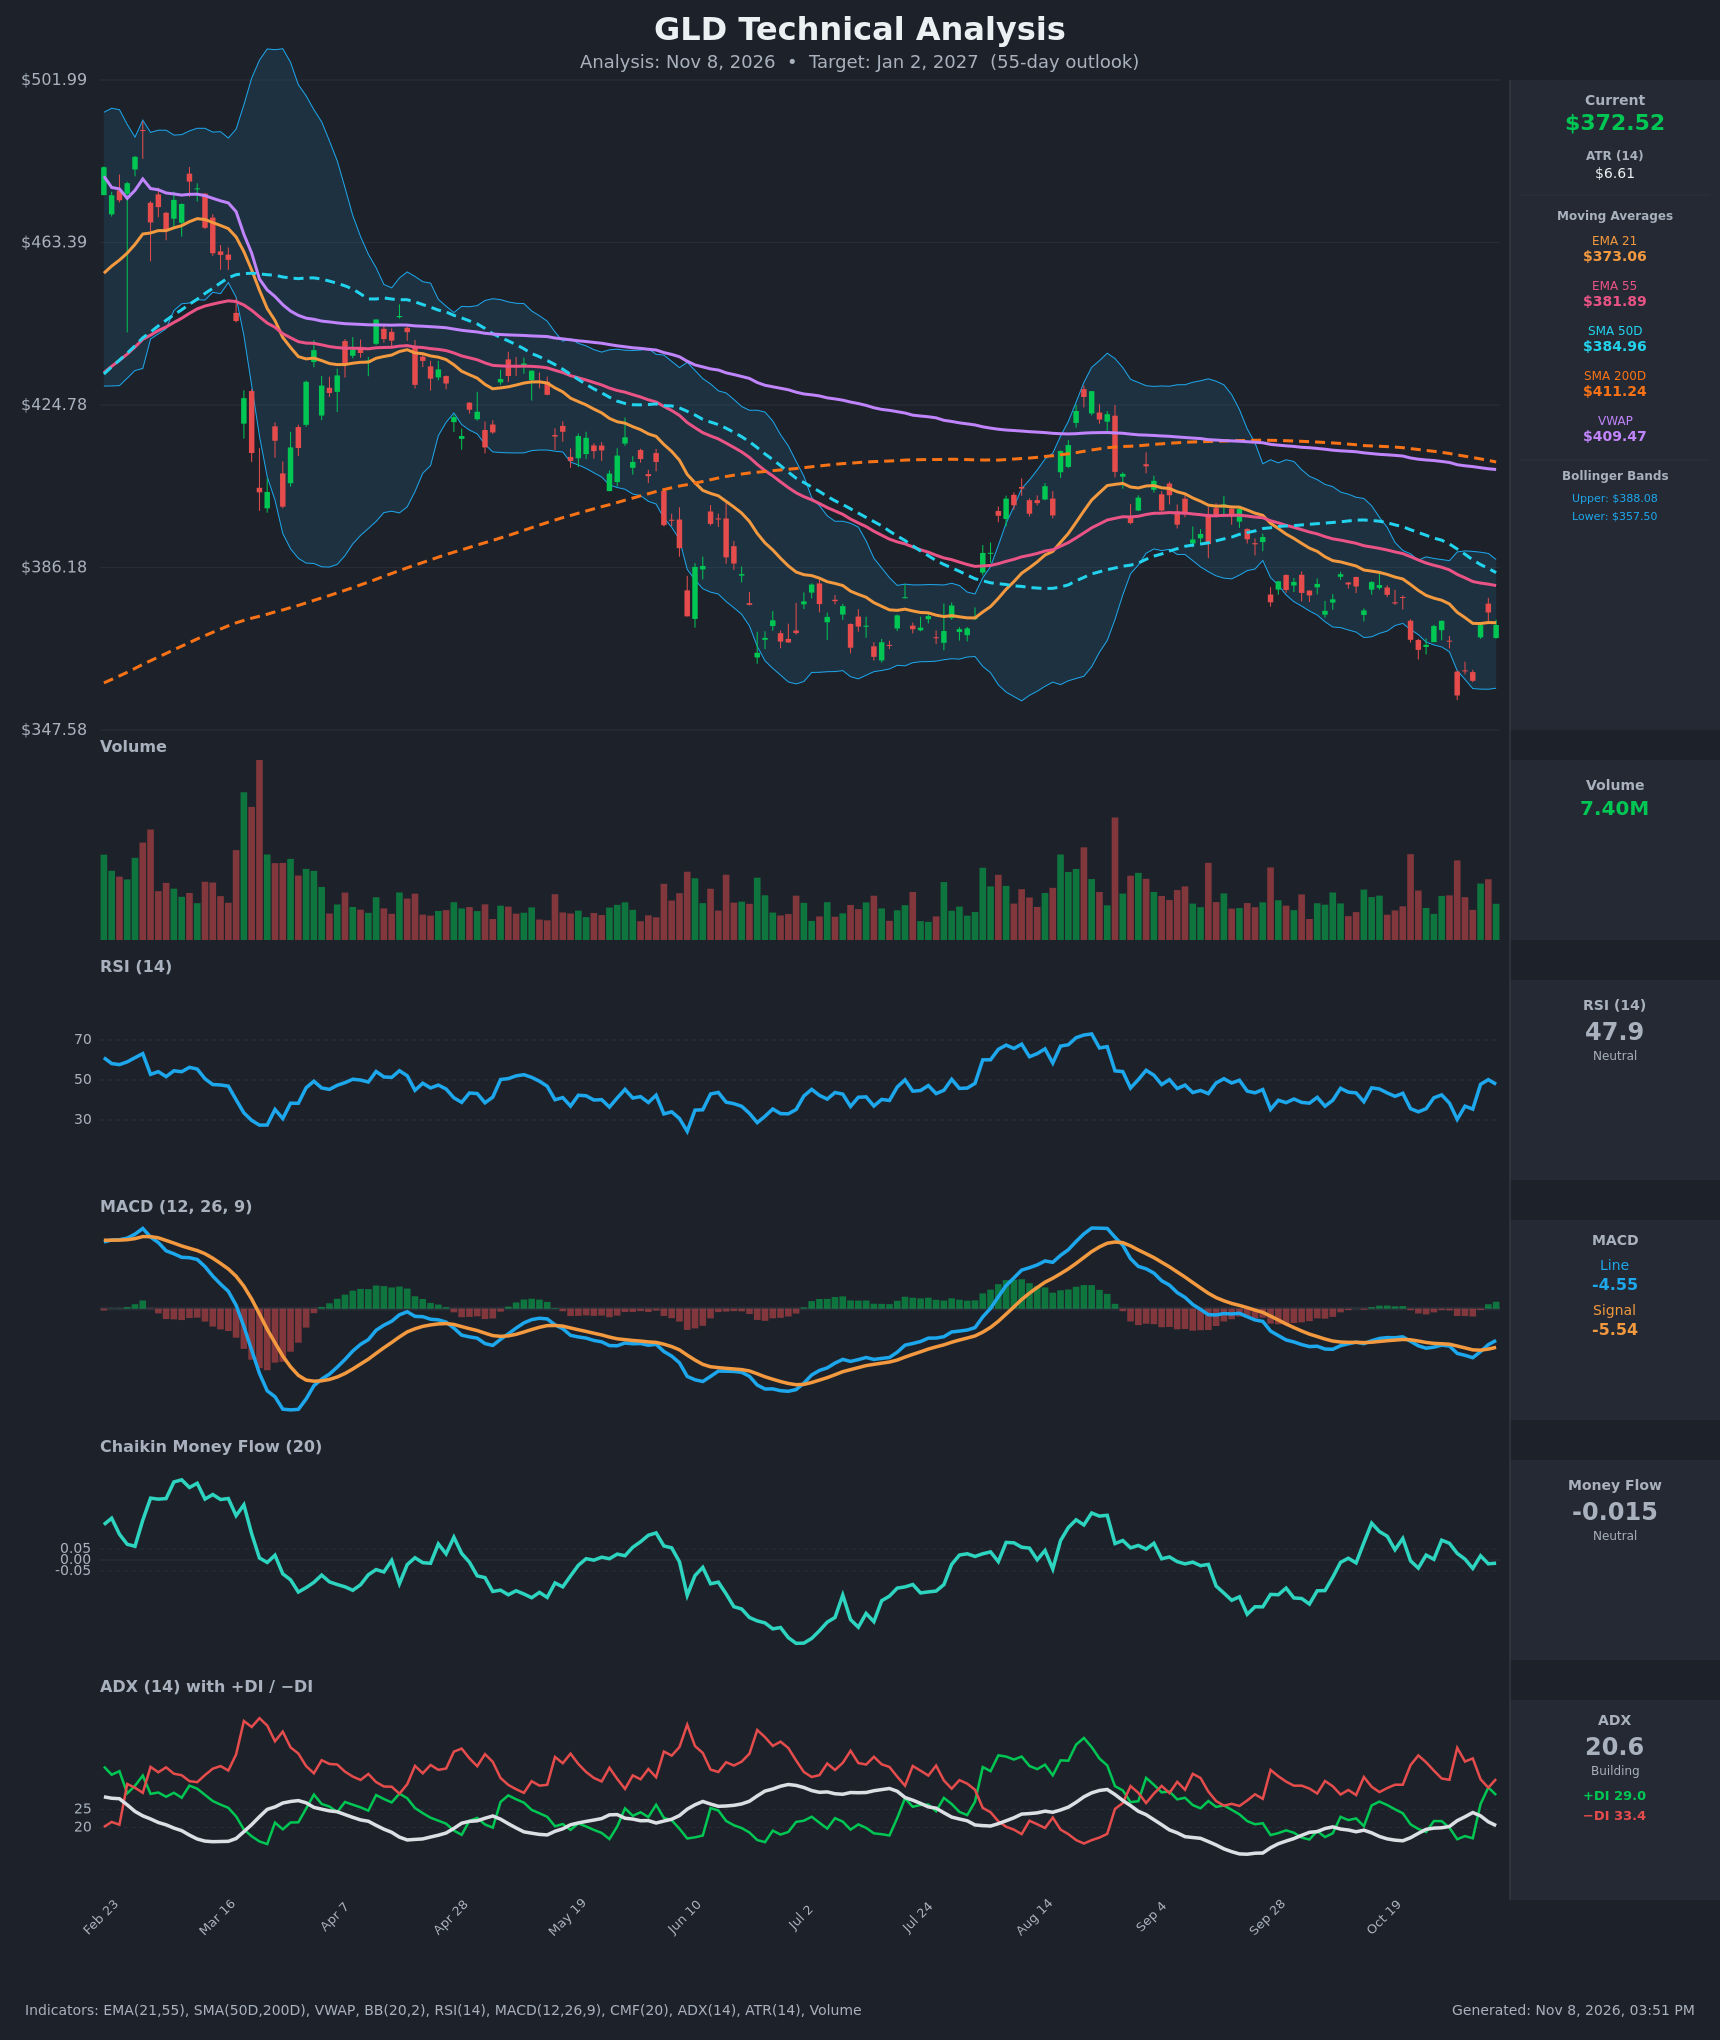
- RSI (14): 47.89, neutral. It has recovered from oversold (30.3 on Oct 30) to just under 50, so short-term momentum is improving. The chart shows RSI has held below 50-55 since the August peak, which fits a bear-market bounce. [Neutral]
- 20 EMA: The EMA21 is $373.06 and price is $372.52, essentially on it. The EMA21 is below the EMA55 ($381.89), so the short-term trend is still down. Price has failed to hold above the EMA21 for any length of time since early October. [Neutral]
- MACD: The line is -4.55, the signal -5.54, and the histogram is about +0.99. A bullish crossover occurred on Nov 4-5, but all of it is below the zero line. That makes it a relief bounce within a downtrend rather than a confirmed trend reversal. [Bullish]
- Bollinger Bands (20): Upper $388.08, lower $357.50, midline about $372.8. Price bounced off the lower band (Oct 30 low) and is now at the midline. The bands are narrowing, with the upper band sloping down, which is typical of a bearish drift. The test of the midline is the key battleground. [Neutral]
- CMF (20): -0.015, between ±0.05, so there is no meaningful accumulation or distribution. It has oscillated around zero for weeks, showing no sustained buying conviction on the bounces. [Neutral]
- ADX (14): 20.6 and falling from 24.1, with −DI (33.4) above +DI (29.0). The trend is weak but the bears still lead. The DI spread has narrowed sharply from 42.0 vs 16.8 on Oct 30, so selling pressure is fading. [Weak Trend, Bearish lean]
- Volume: 7.40M, near average, with no high-volume capitulation or breakout. Heavier red bars in the recent decline (late October) suggest selling pressure outweighed buying, and the bounce has come on average volume. [Neutral to slightly Bearish]
DIVERGENCES & TRENDS
- Moving-average structure: Price ($372.52) is below the EMA55 ($381.89), SMA50 ($384.96), SMA200 ($411.24) and VWAP ($409.47). The SMA50 is below the SMA200, which is a death-cross configuration and a long-term downtrend. All the longer averages are still sloping down.
- MACD vs. price: The MACD line made a slightly higher low (-7.01) than its earlier trough and has crossed up through the signal. Price made a marginally lower low in late October, so there is a mild bullish divergence, but it is not yet confirmed by a zero-line break.
- RSI: It rebounded from 30 to about 48-50. The cap at 50 matches prior failures in September and October.
- DI: The DI spread is compressing and +DI is rising, so downside momentum is easing. ADX below 25 means no strong trend is in place in either direction.
- Price swings: The sequence of lower highs since August (about $430 → $405 → $385) is intact. The $352-359 area has held as a double-bottom-like low (Oct 30 and Nov 3).
CHART PATTERNS
- Dominant structure: A long-term downtrend with a lower-high sequence since August, now consolidating in a narrowing range, similar to a Bearish Pennant or Descending Triangle continuation. Resistance is the falling SMA50/EMA55 cluster at $382-385. Support is the flat $355-359 low. A break below $355 would project roughly $335-340, measured from the range height of about $30.
- Counter-pattern: The Oct 30 and Nov 3 lows resemble a small Bullish Double Bottom with a neckline near $376-380. A close above about $380 would target roughly $400-405, near the SMA200 and VWAP zone. This is not yet confirmed.
POTENTIAL SCENARIOS
- Scenario 1: Bearish Downtrend Resumes — Price is rejected at the falling EMA55/SMA50 cluster and the MACD bounce fails below zero. The lower-high sequence continues, and the market retests and breaks the $355-357 lower band zone. Trigger: a close below $365, then a break of $355. Target: $345-350, with an extension toward $338. Invalidation: a daily close above $386. (45% probability)
- Scenario 2: Bullish Relief Rally / Double Bottom Breakout — The MACD crossover and recovering DI spread lead to a break above the neckline and the SMA50. Price squeezes toward the SMA200/VWAP area. Trigger: a close above $380-385 on rising volume with MACD crossing above zero. Target: $398-405. Invalidation: a close below $358. (33% probability)
- Scenario 3: Neutral Range Consolidation — With ADX below 20-25, price chops between support around $357 and the SMA50/upper band around $385-388 for the whole period. Trigger: repeated rejections at both ends of the range. Target: $365-378. Invalidation: a close outside $355-$388. (22% probability)
PRICE TARGETS
- Target Price: $364.00 (55 days, Jan 2, 2027)
- Expected Range: $340.00 to $398.00 (width $58, about 15.6% of the current price, consistent with the 30-60 day guidance)
- Key Levels: Support at $355.00, Resistance at $385.00
OVERALL BIAS
OVERALL BIAS: BEARISH - Price sits below the EMA55, SMA50, SMA200 and VWAP, with a death-cross structure, lower highs since August, and −DI still above +DI. The bullish MACD cross is occurring below zero in a weak-ADX environment, so it looks more like a bounce within the downtrend than a reversal. Conviction is modest, since the double-bottom and MACD signals could produce a relief rally toward $385-400.
This is educational analysis and not financial advice.