IREN 55-day bearish forecast — Nov 8, 2026
- Bias: Bearish
- Timeframe: 55 days (made Nov 8, 2026, target date Jan 1, 2027)
- Price at analysis: $21.64
- Price target: $19.50
- Expected range: $17.40 – $21.30
- Result: Pending — graded after the close on Jan 1, 2027
Get a free AI analysis of IREN today
Analysis
TECHNICAL INDICATORS
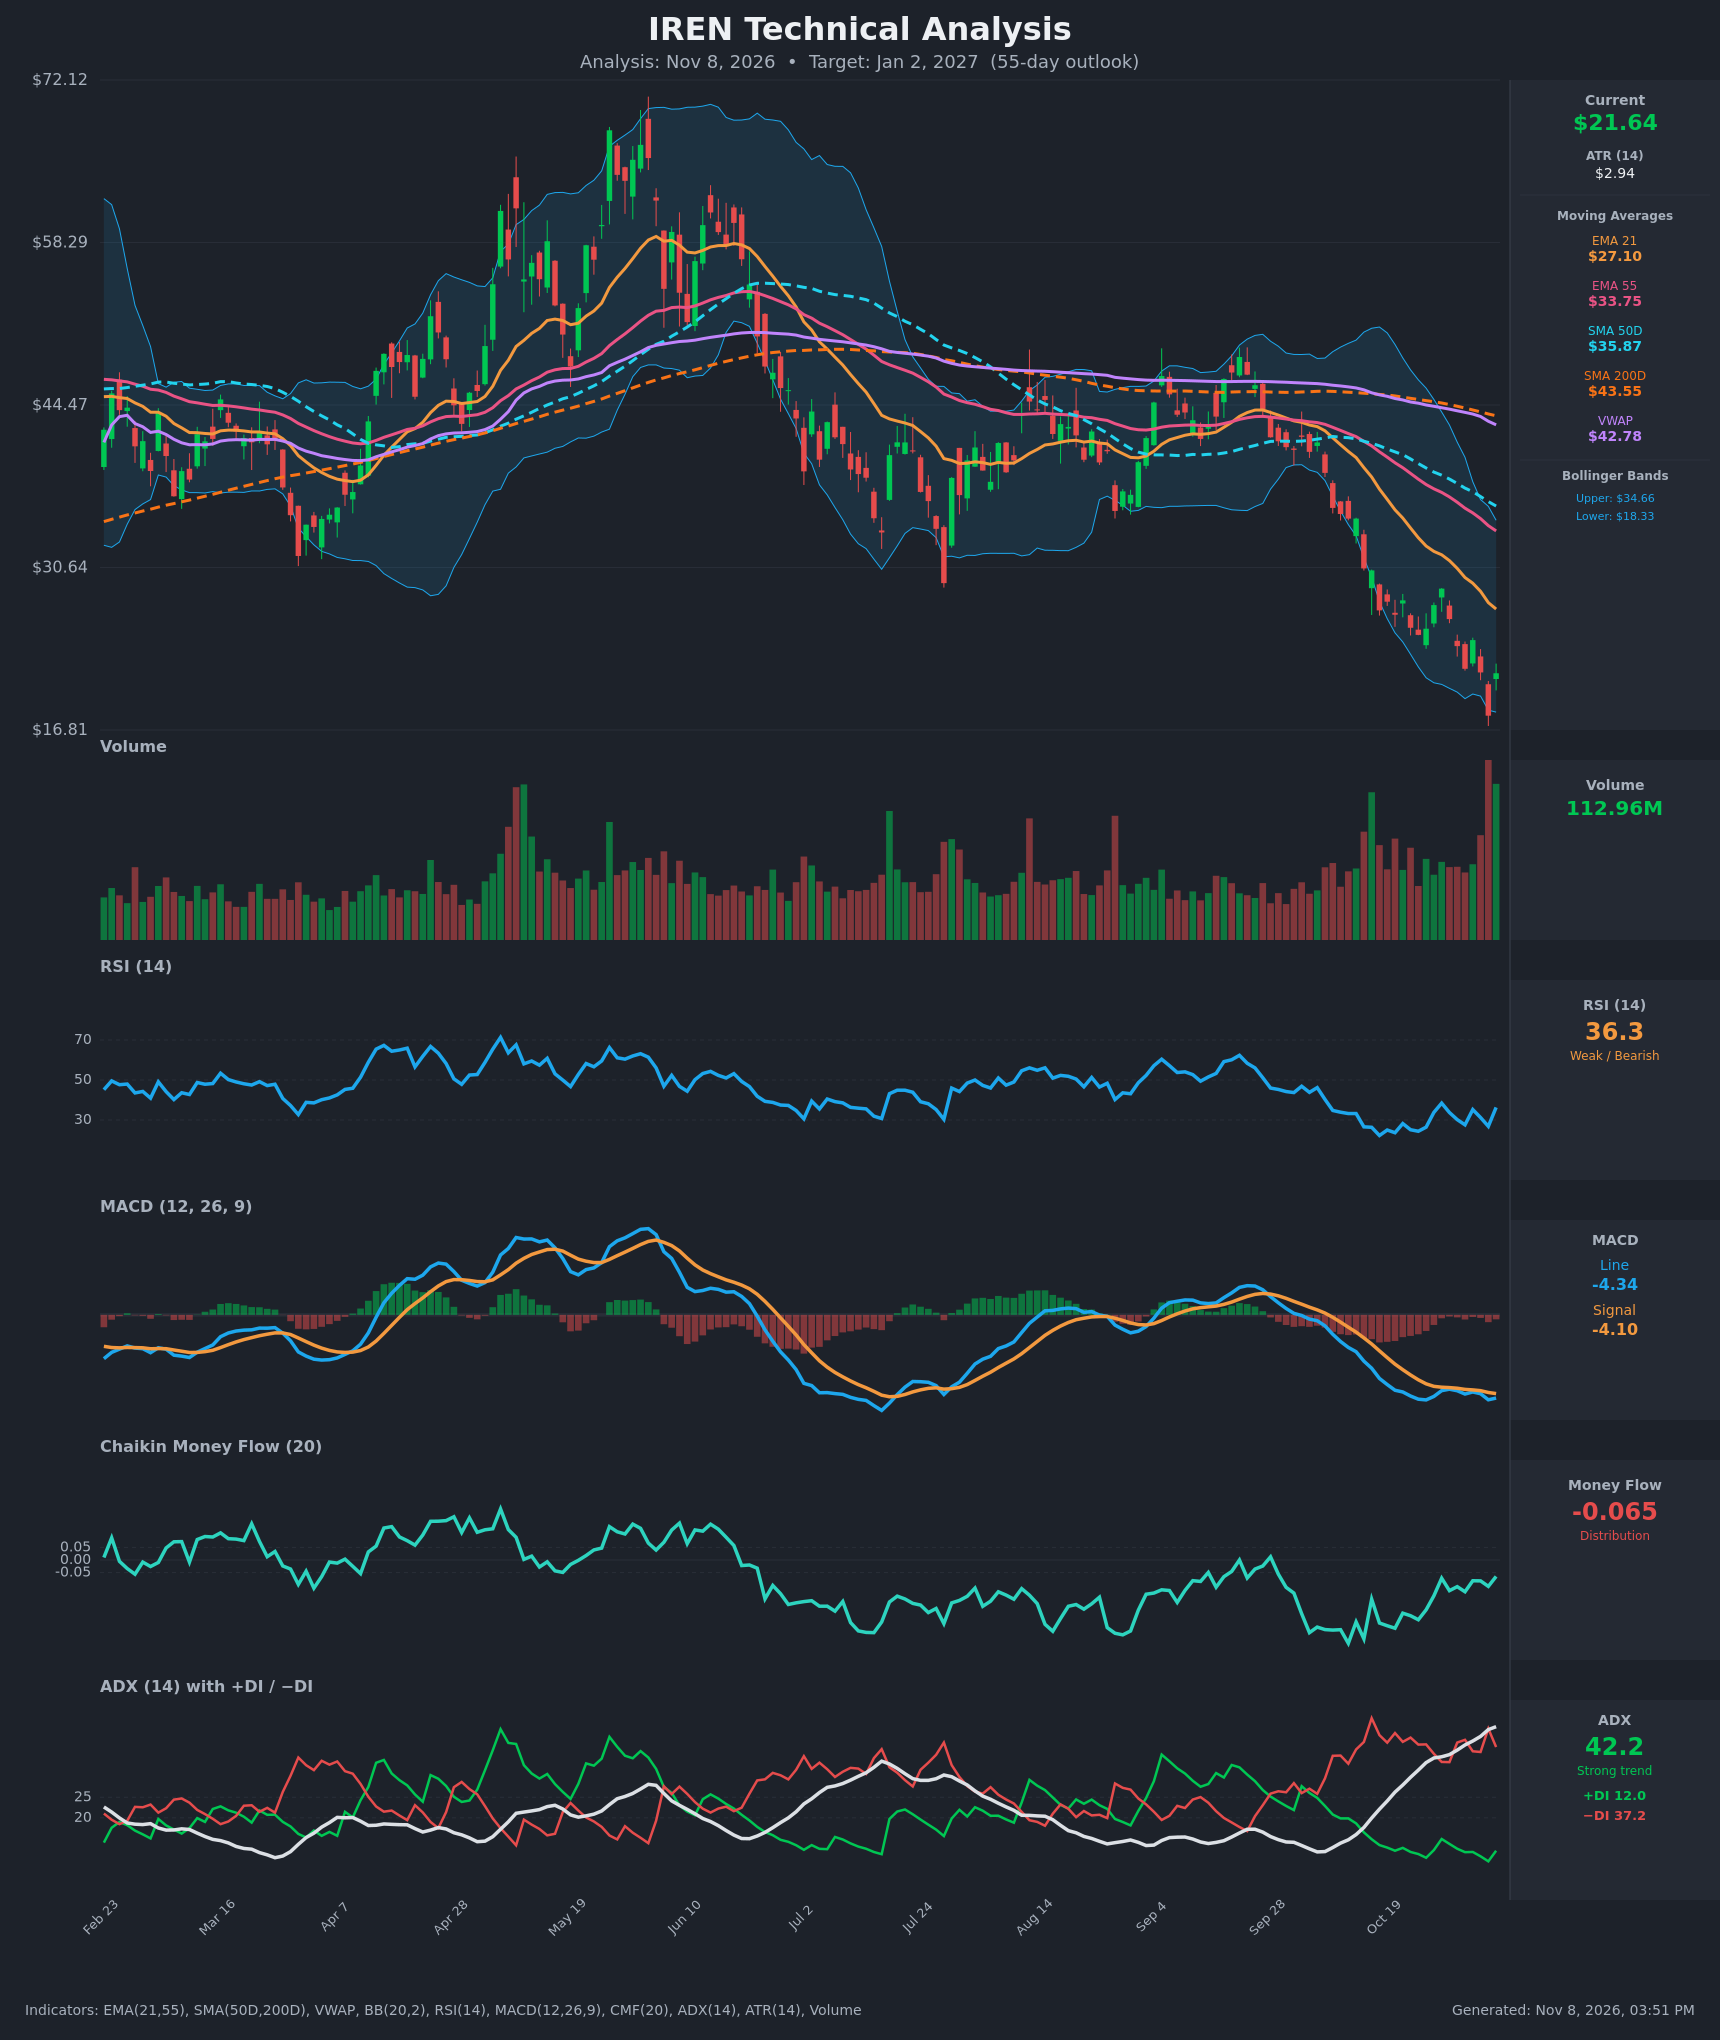
- RSI (14): 36.29, up from a 26.8 low on Nov 5 but still under 40, so it sits in bearish territory. RSI has been stuck between 23 and 38 for three weeks, which is typical of a persistent downtrend. The bounce is not yet a momentum shift. [Bearish]
- 20 EMA: The chart uses the 21 EMA at $27.10, and price at $21.64 is about 20% below it. The EMA is falling steeply (from $36.44 on Oct 19) and acts as overhead resistance. The 21 EMA is also below the 55 EMA ($33.75), a bearish alignment. [Bearish]
- MACD: The line is -4.335 and the signal is -4.103, so the line is still below the signal. The histogram is slightly negative (about -0.23). There has been no bullish crossover, and the line has stayed below the signal for about three weeks. The histogram is contracting compared with the earlier deep red, so downside momentum is flattening but not reversing. [Bearish]
- Bollinger Bands (20): Upper is $34.66 and lower is $18.33. Price at $21.64 is in the lower third of the bands, after a Nov 5 close at $18.03 that pierced the lower band. The bands are wide and sloping down, which signals an expanded-volatility trend. The close back inside the bands hints at a relief bounce, but price has been riding the lower band. [Bearish]
- CMF (20): -0.065, below the -0.05 threshold, so it still shows mild distribution. It has improved sharply from -0.27 on Oct 20, which shows selling pressure fading. It has not turned positive. [Distribution]
- ADX (14): 42.2 and rising steadily, with −DI at 37.2 well above +DI at 12.0. This is a strong, mature downtrend with bears firmly in control. An ADX above 40 can also signal trend exhaustion, but there is no DI crossover yet. [Strong Trend – Bearish]
- Volume: 112.96M, the highest in the visible history, on a green reversal candle. The prior day's capitulation-style drop to $18.03 also came on heavy volume. This looks like a selling climax with a possible short-term bottom. A single high-volume bounce candle does not confirm a trend change. [Capitulation / Possible Relief Bounce]
DIVERGENCES & TRENDS
- Mild bullish divergence: Price made a lower low at $18.03 while RSI (26.8) held above its Oct 20 low of 23.6, and CMF has been rising since Oct 20. These are early signs of selling exhaustion, but they are not confirmed by a MACD cross.
- Moving average structure: Price is below every moving average: the 21 EMA ($27.10), 55 EMA ($33.75), SMA50 ($35.87), SMA200 ($43.55) and VWAP ($42.78). The SMA50 is below the SMA200 (death cross), and the 21 EMA is below the 55 EMA. All of this is a fully bearish stack.
- Gap to the averages: Price is about 50% below VWAP and the SMA200. The market is extremely stretched, which raises the odds of sharp counter-trend rallies. Those rallies would run into declining moving averages.
- ADX and DI: −DI has been above +DI for several weeks and ADX is rising, so the trend is accelerating. ADX above 40 often precedes consolidation.
- MACD: No crossover yet. The line and signal are both negative and close together, so a bullish cross could come soon if the bounce holds.
CHART PATTERNS
- Bearish continuation structure: The late-October consolidation of lower highs ($28.84 on Oct 28) resembled a bearish flag or pennant. It resolved lower, and the measured move from the flag points to the $18–$20 area, which was reached on Nov 5.
- Possible bullish falling wedge or double bottom: If price holds above $18 and forms a higher low, a Bullish Falling Wedge or Double Bottom reversal could develop. A close above the neckline near $24.50–$25.50 would be needed, and that is not confirmed.
- Large-scale picture: Price has fallen from the $65–$70 peak in June (a rounded top and double-top-like structure), through the SMA200, to $18. This is a clear lower-high, lower-low sequence.
POTENTIAL SCENARIOS
- Scenario 1: Bearish Trend Resumption — The Nov 6 bounce fades under the declining 21 EMA and the $24–$25 supply zone. Sellers push price back to retest the Nov 5 low, and the strong trend keeps price pinned to the lower band. Trigger: rejection at $24–$25 or a close below $20.50. Target: $17.50–$19.50, with an extension toward $16.80 on a break of $18.03. Invalidation: a daily close above $27.10 (21 EMA) with a MACD bullish cross. (50% probability)
- Scenario 2: Bullish Relief Rally / Capitulation Reversal — The record-volume reversal marks a selling climax. Price squeezes up to the declining 21 EMA, helped by CMF and RSI divergences and short covering. Trigger: a daily close above $24.50 on solid volume, with a MACD bullish cross. Target: $27–$29 (21 EMA and the Oct 28 high). Invalidation: a close below $18.03. (35% probability)
- Scenario 3: Neutral Basing Range — Price chops between $18 and $24.50 as volatility compresses and ADX falls from its extreme. Trigger: failure to break either $18.03 or $24.50 for several weeks. Target: about $21–$22. Invalidation: a daily close outside the $18–$24.50 range. (15% probability)
PRICE TARGETS
- Target Price: $19.50 (55-day, Jan 2, 2027)
- Expected Range: $17.40 to $21.30 (width $3.90, about 18% of the current price, in line with the 30–60 day guidance)
- Key Levels: Support at $18.03, Resistance at $24.50
OVERALL BIAS
OVERALL BIAS: BEARISH - A strong, mature downtrend (ADX 42, −DI 37 vs +DI 12) with price below every moving average, a death cross in place, and MACD still below its signal line favors continued weakness. The high-volume bounce and improving CMF and RSI make a relief rally likely along the way, but rallies are likely to meet resistance at the declining 21 EMA and the $24–$25 zone.
This is educational analysis and not financial advice.