MARA 55-day bearish forecast — Nov 8, 2026
- Bias: Bearish
- Timeframe: 55 days (made Nov 8, 2026, target date Jan 1, 2027)
- Price at analysis: $6.35
- Price target: $5.95
- Expected range: $5.35 – $6.50
- Result: Pending — graded after the close on Jan 1, 2027
Get a free AI analysis of MARA today
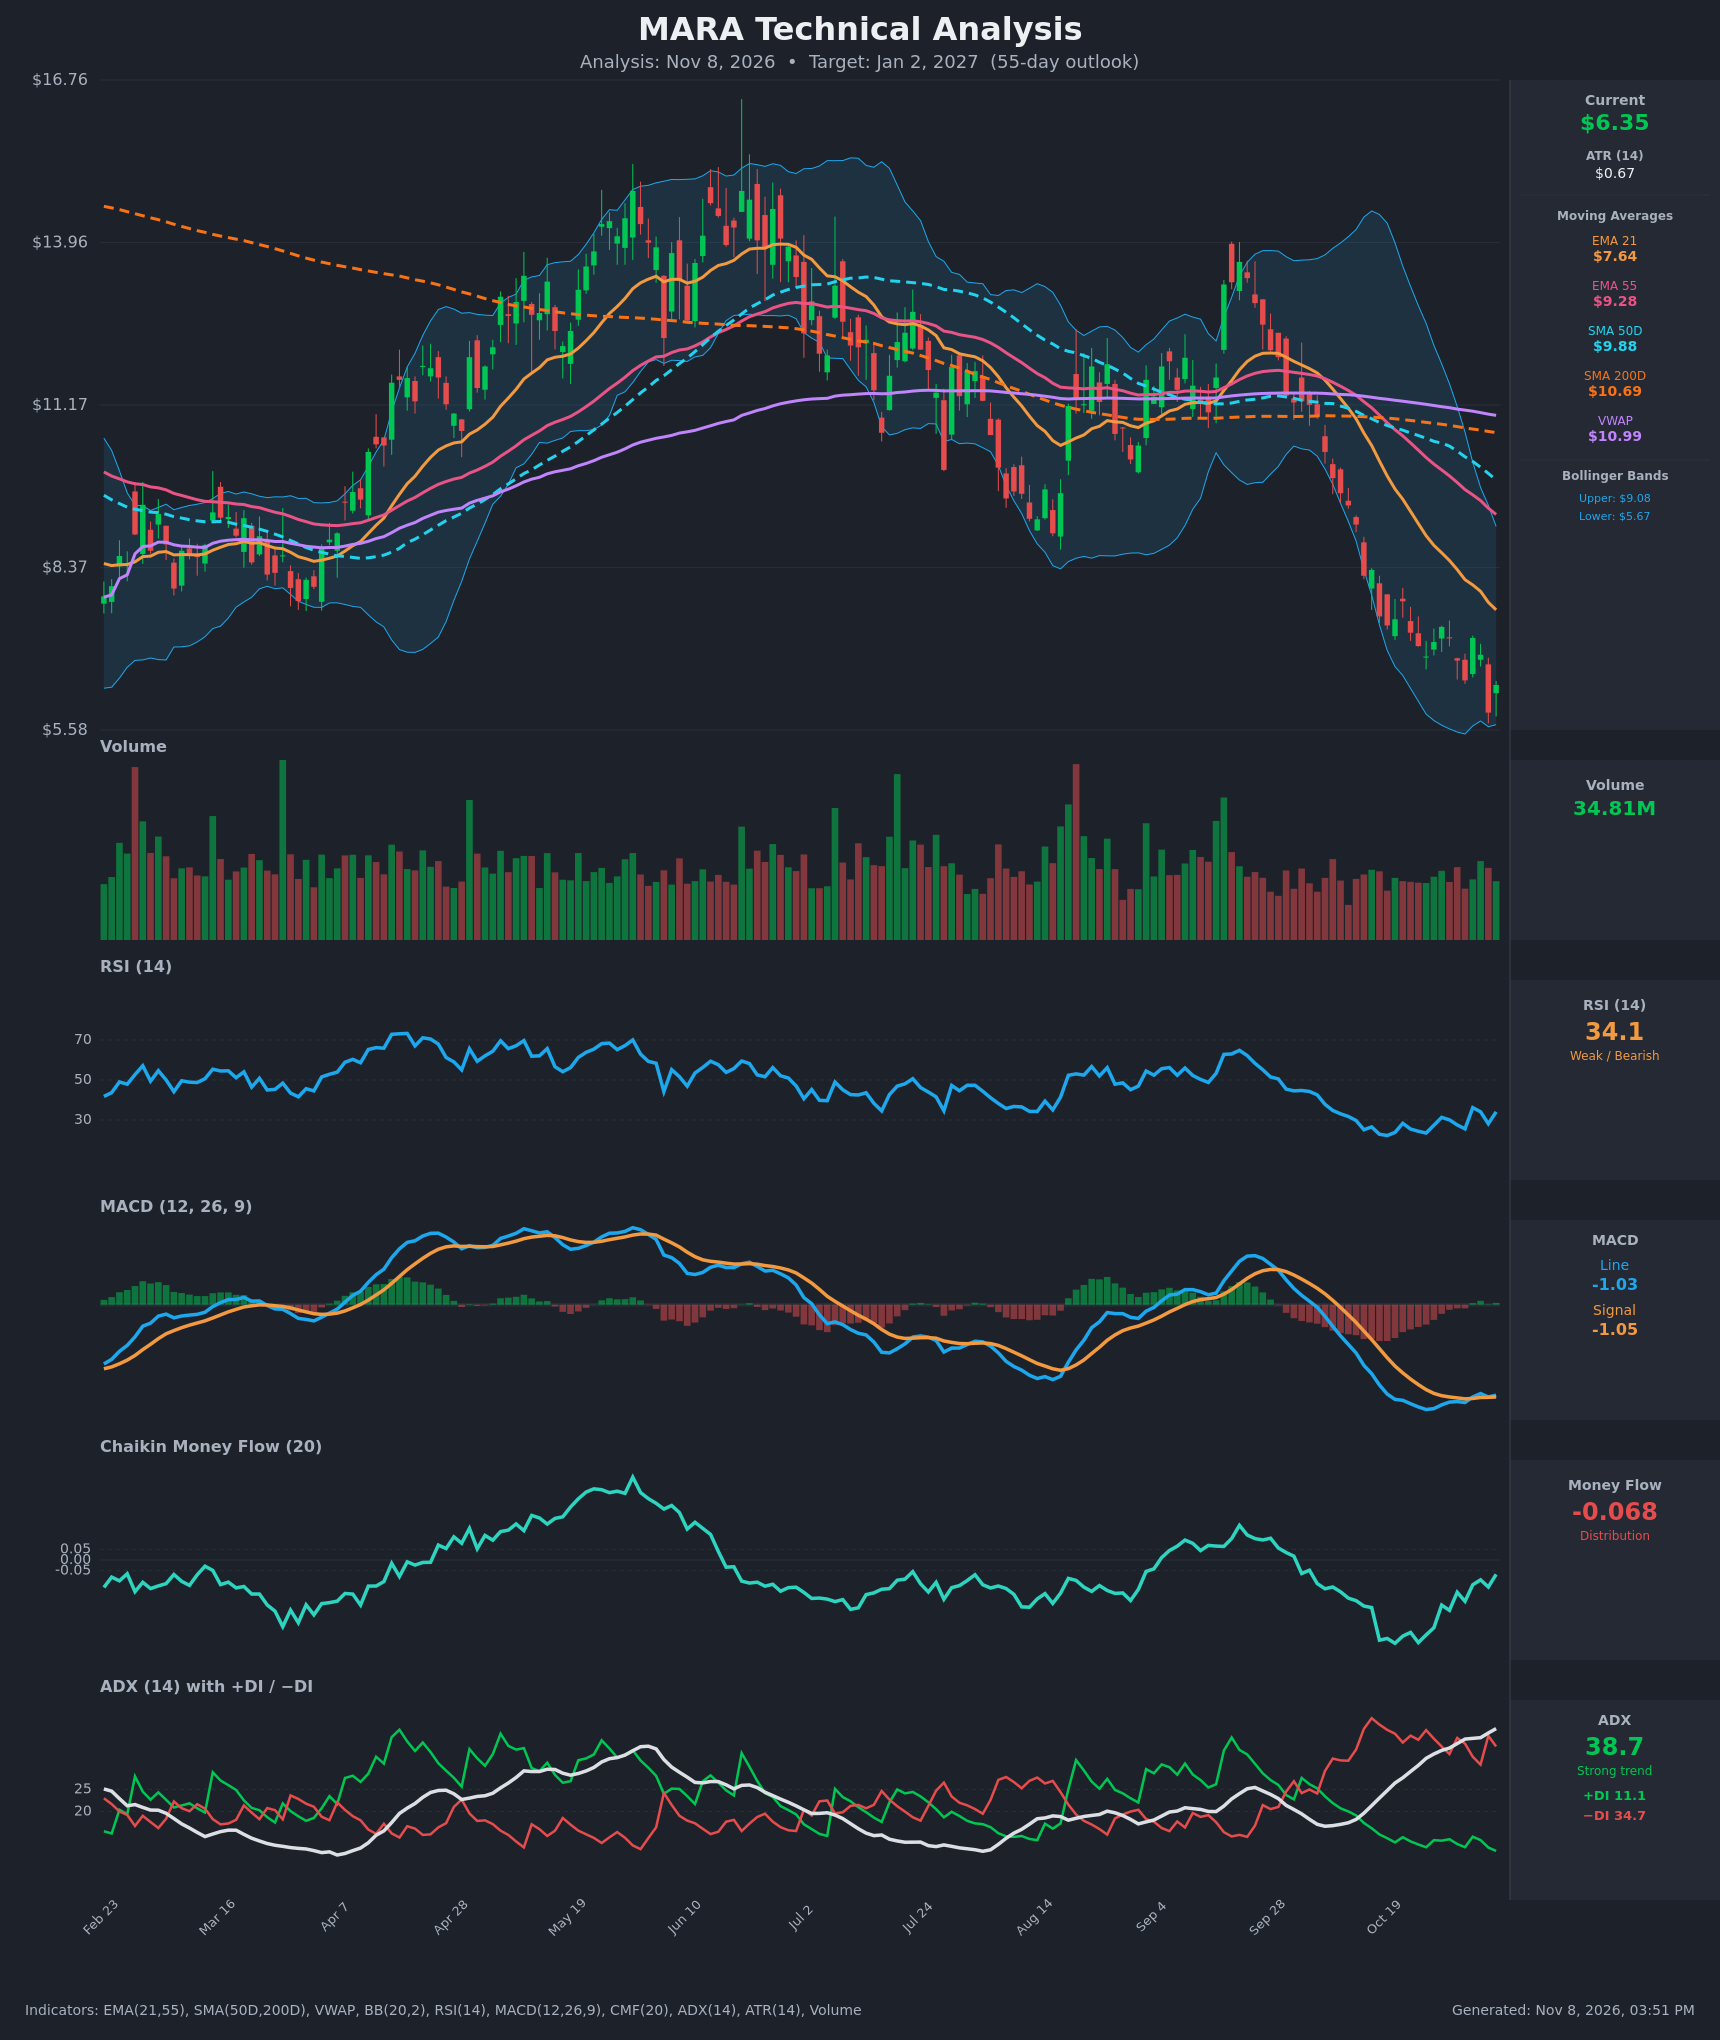
Analysis
TECHNICAL INDICATORS
- RSI (14): 34.07, up from a 22.2 low on Oct 19 but still below 40 and capped under 36 on the Nov 3 bounce. Momentum is weak but not yet oversold. The reading of 28 on Nov 5 was above the 23.5 of Oct 26, even though price made a lower low. [Bearish]
- 20 EMA: The supplied EMA 21 is $7.64, with price at $6.35, about 17% below it. The EMA is falling steeply (from $9.95 on Oct 19) and acts as overhead resistance. EMA 21 is also well below EMA 55 ($9.28). [Bearish]
- MACD: Line -1.026 vs signal -1.046, so the line sits barely above the signal. This is a marginal bullish crossover, and the histogram has flattened to slightly positive after a deeply negative stretch. Both lines are far below zero, so this reads as fading downside momentum rather than a trend reversal. [Neutral]
- Bollinger Bands (20): Upper $9.08, lower $5.67, with price at $6.35 in the lower quarter of the bands. The bands are wide after the sharp selloff, and the Nov 5 close at $5.88 rode the lower band. Walking the lower band in a strong trend is bearish, though a bounce toward the midline (~$7.37) is possible. [Bearish]
- CMF (20): -0.068, in distribution territory but improving sharply from about -0.39 in late October. Selling pressure is easing, but buyers have not yet taken control. [Distribution]
- ADX (14): 38.7 and rising, with −DI (34.7) far above +DI (11.1). This is a strong, established downtrend with bears firmly in control. +DI has been pinned between 11 and 14 for weeks. [Strong Trend – Bearish]
- Volume: 34.81M, roughly flat or average, with no capitulation spike on the decline. The lack of a blow-off volume bar suggests the selloff may not be exhausted. Red candles have slightly outweighed green ones. [Neutral to mildly Bearish]
DIVERGENCES & TRENDS
- Bullish divergence (short-term): Price made a lower low on Nov 5 ($5.88) than on Oct 26 ($6.84). RSI (28.1 vs 23.5) and CMF (-0.127 vs -0.352) both made higher lows. The MACD histogram is also rising. This hints at fading selling momentum and raises the odds of a relief bounce.
- Trend structure: The moving-average stack is fully bearish: price < EMA21 < EMA55 < SMA50D ($9.88) < SMA200D ($10.69) < VWAP ($10.99). SMA50D crossed below SMA200D in early November (a death cross, 10.37 vs 10.80 on Oct 30). EMA21 crossed below EMA55 well before that.
- Price vs 200-day: Price is about 41% below the SMA200D, which means a long-term downtrend and also a heavily stretched, mean-reversion-prone setup.
- Crossovers: The MACD is flirting with a bullish cross while below zero, a low-quality signal. The DI spread remains deeply bearish. Lower highs have formed since the late-September peak near $13.8.
CHART PATTERNS
- Bearish continuation structure: Price made a sharp impulse decline from about $13.8 to about $7, followed by small-range consolidation near $7.0–7.4. It then broke lower, which resembles a Bearish Pennant / Flag that resolved down. The measured move from the pennant break points toward the high-$5 area, which is already being tested.
- Larger context: The rally to ~$16 and the roll-over below the 50- and 200-day averages resemble a Bearish Head and Shoulders / rounded top on the broader chart. The neckline area (~$8.5–11) has been decisively lost, and the multi-month downtrend is intact.
- Counter-pattern: A possible Bullish Falling Wedge / Double Bottom is forming at $5.6–5.9 (Oct 26 low area and Nov 5 low). It is not confirmed without a close above $7.2.
POTENTIAL SCENARIOS
- Scenario 1: Bearish Trend Continuation — The strong ADX and −DI dominance, with price below every moving average, favor further grinding lower. Rallies are sold at falling EMA21 resistance. Trigger: close below $5.88 and then the $5.58–$5.67 support/lower-band zone. Target: $5.40–$5.95. Invalidation: daily close above $7.25 with the MACD histogram turning positive. (50% probability)
- Scenario 2: Bullish Relief Bounce — The RSI/CMF divergence and MACD flattening fuel a mean-reversion bounce toward the BB midline and EMA21 before sellers return. Trigger: close above $7.16 on rising volume. Target: $7.40–$7.65 (EMA21). Invalidation: loss of $5.58. (32% probability)
- Scenario 3: Neutral Basing Range — Price chops between $5.60 and $7.00 as selling exhausts but buyers lack conviction. Trigger: repeated holds above $5.67 without a close above $7.16. Target: $6.20–$6.60. Invalidation: a close outside the $5.58–$7.16 range. (18% probability)
PRICE TARGETS
Timeframe: 55 days (30–60 day band, so a ~12–18% width).
- Target Price: $5.95 (modestly below the current $6.35, reflecting trend continuation tempered by oversold-bounce risk)
- Expected Range: $5.35 to $6.50 (width $1.15 ≈ 18.1% of the current price)
- Key Levels: Support at $5.58, Resistance at $7.16
OVERALL BIAS
OVERALL BIAS: BEARISH - ADX of 38.7 with −DI far above +DI, price below every key moving average (including a fresh death cross), and negative CMF point to further downside. The short-term RSI/CMF divergence argues for a possible bounce, which tempers conviction and the size of the expected decline.
This is educational analysis and not financial advice.