MSTR 55-day bearish forecast — Nov 8, 2026
- Bias: Bearish
- Timeframe: 55 days (made Nov 8, 2026, target date Jan 1, 2027)
- Price at analysis: $128.93
- Price target: $118.50
- Expected range: $109.00 – $131.00
- Result: Pending — graded after the close on Jan 1, 2027
Get a free AI analysis of MSTR today
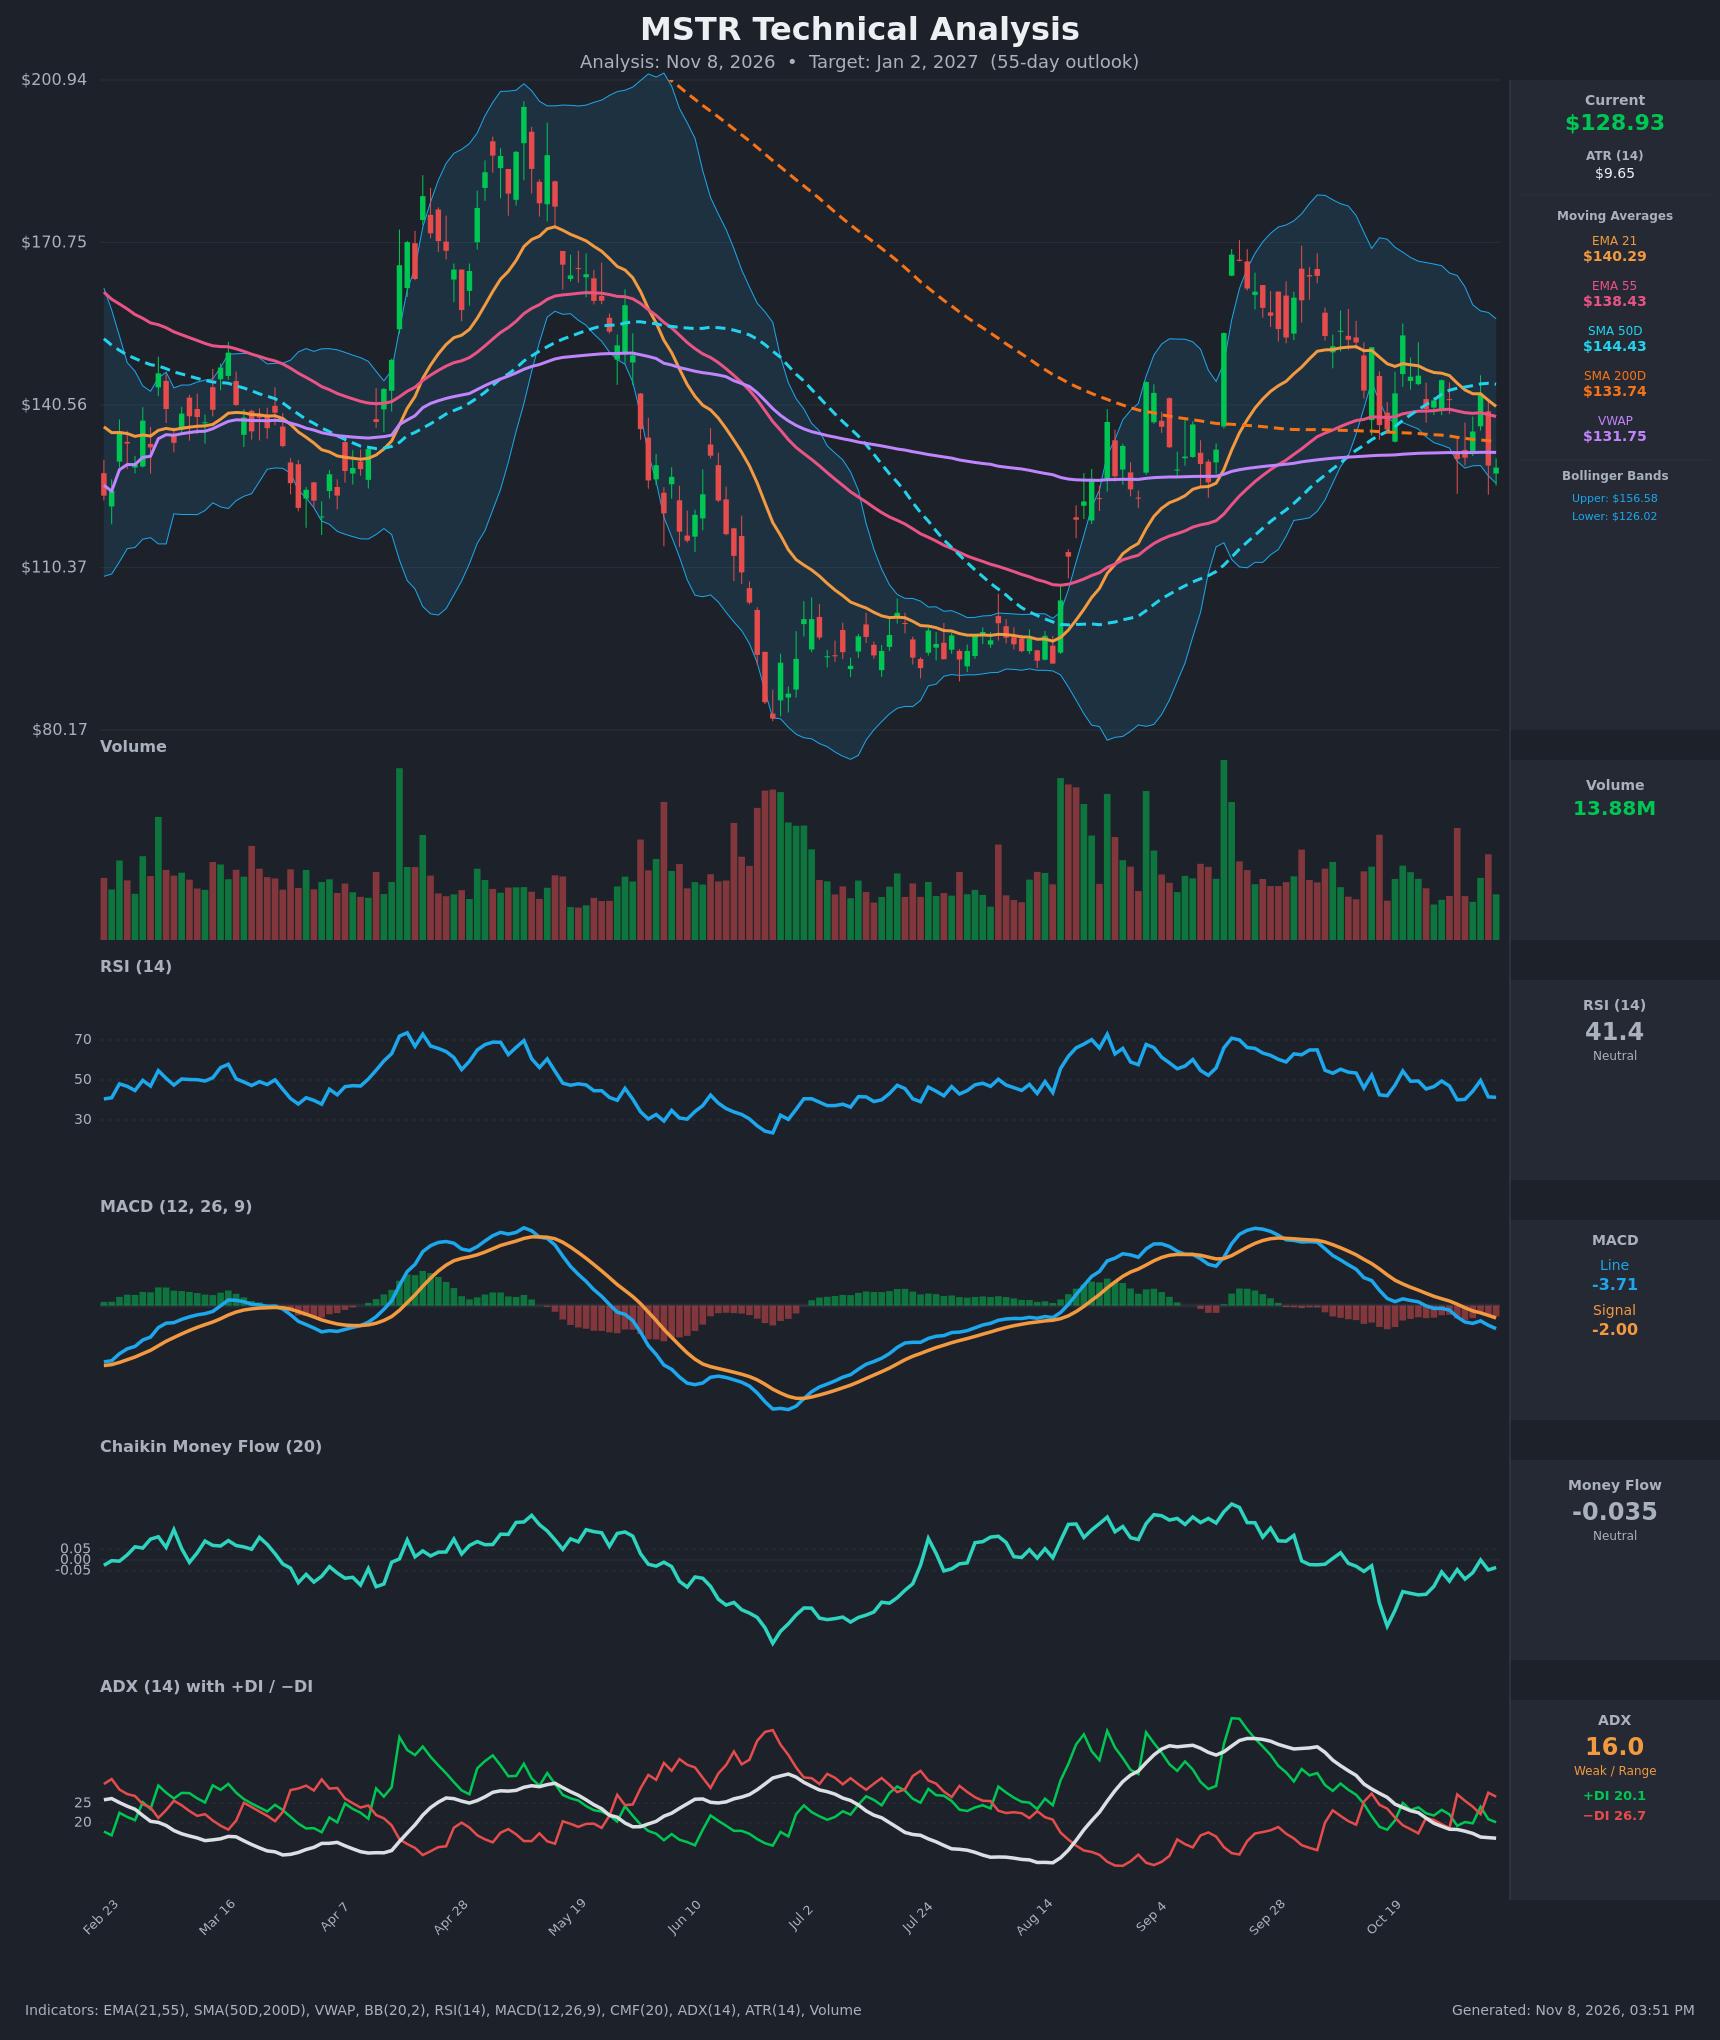
Analysis
TECHNICAL INDICATORS
- RSI (14): 41.35, below the 50 midline but not oversold. It has been capped under 50 on every bounce (49.7 on Nov 4), which shows momentum is leaning down without being exhausted. [Bearish]
- 20 EMA (EMA 21 = $140.29): Price at $128.93 is about 8% below it, and the EMA is falling (148.2 to 140.3 in 15 bars). It acts as overhead resistance. EMA 21 is also converging toward EMA 55 ($138.43) and is about to cross below it. [Bearish]
- MACD: Line -3.71 is below Signal -2.00, and the histogram is negative and widening. The bearish crossover happened around Oct 26, and momentum is still deteriorating. [Bearish]
- Bollinger Bands (20): Upper $156.58, lower $126.02. Price sits in the bottom 10% of the band, about $2.9 above the lower band. The bands are wide, so volatility is still elevated. Lower-band riding can mean oversold bounces, but with weak ADX and falling momentum it more often signals a retest or break of that floor. [Neutral to Bearish]
- CMF (20): -0.035, inside the ±0.05 neutral zone. It has recovered from -0.31 on Oct 19, so selling pressure has eased but buyers have not taken control. [Neutral]
- ADX (14): 16.0, with -DI (26.7) above +DI (20.1). ADX is below 20 and falling, so there is no strong trend, but the directional edge belongs to the bears. [Weak Trend, Bearish lean]
- Volume: 13.88M, moderate and not a capitulation spike. Recent down days (Oct 30, Nov 5) carried heavier volume than the up days, a mild sign of distribution. [Mildly Bearish]
Other moving averages and VWAP:
- Price is below SMA 50 ($144.43), SMA 200 ($133.74) and VWAP ($131.75), so it is under every major average.
- SMA 50 is rolling over after a golden cross above the SMA 200, and a death cross is possible later if weakness persists.
DIVERGENCES & TRENDS
- Minor bullish divergence: On Nov 6 price made a marginally lower low ($128.93 vs. $130.51 on Oct 30), while RSI is slightly higher (41.4 vs. 40.1). CMF has also improved a lot since Oct 19. This is weak evidence of selling fatigue, not a reversal signal.
- Bearish trend in momentum: MACD has crossed below Signal and zero, and the histogram is expanding negatively. EMA 21 has crossed below SMA 50 and is converging on EMA 55.
- Lower highs: The Sep peak near $170 was followed by a lower rally high near $153 (Oct 21) and a failed bounce at $142.5 (Nov 4). The trend is rolling over beneath the declining EMA 21.
- DI crossover: -DI crossed back above +DI on Oct 30 and has stayed there, so bears have the edge even though ADX is low.
CHART PATTERNS
- Descending Triangle / Bearish Flag (loose fit): Lower highs ($170, $153, $142.5) are pressing on a horizontal floor around $126-130. Price has tested $130.5, $129.3 and $128.9 repeatedly. A confirmed break below roughly $126 (also the lower Bollinger Band) would project a measured move of about 10-15% to the $108-$115 zone.
- Failure of the Sep rally: The recovery from the ~$95 base stalled under the $170 area and failed to hold above the EMAs. This is consistent with a lower-high structure and a possible bearish continuation.
- Bullish counter-case: The $126-$130 base has held twice. A bounce above the SMA 200 ($133.74) and VWAP ($131.75) would invalidate the descending-triangle read.
POTENTIAL SCENARIOS
- Scenario 1: Bearish Breakdown of the $126 Floor — Price fails at the declining EMA 21 and VWAP and breaks the $126-$129 floor, so the descending triangle resolves lower. MACD stays below Signal and -DI stays dominant. Trigger: daily close below $126.00 on rising volume. Target: $112-$118, with an extension toward $108. Invalidation: daily close above $134 (SMA 200), then above $140. (50% probability)
- Scenario 2: Bullish Base Hold and Relief Rally — The $126-$130 floor holds, CMF turns positive and RSI recovers above 50. Price reclaims VWAP and the SMA 200 and heads back toward the EMAs. Trigger: close above $134 with CMF above +0.05. Target: $140-$145 (EMA 21, SMA 50), with an extension to $150. Invalidation: close below $126. (30% probability)
- Scenario 3: Neutral Range Chop — Price oscillates between $120 and $140 with ADX staying below 20, and the Bollinger Bands contract. Trigger: repeated failures at EMA 21 and repeated holds at $125-$128. Target: $125-$135. Invalidation: a decisive close outside $120-$140. (20% probability)
PRICE TARGETS
- Target Price: $118.50 (55 days, about Jan 2, 2027)
- Expected Range: $109.00 to $131.00 (width $22.00, about 17% of the current price, in line with the 30-60 day guidance of 12-18%)
- Key Levels: Support at $126.02 (lower Bollinger Band; next major support $108-$110), Resistance at $133.74 (SMA 200, with VWAP at $131.75 just below it)
OVERALL BIAS
OVERALL BIAS: BEARISH - Price is below every key moving average and VWAP. MACD is negative and widening, -DI leads +DI, and lower highs are pressing on the $126-$130 floor. Conviction is modest because ADX is only 16 and CMF is improving, so the $126 floor is the key level to watch.
This is educational analysis and not financial advice.