NIO 55-day bullish forecast — Nov 8, 2026
- Bias: Bullish
- Timeframe: 55 days (made Nov 8, 2026, target date Jan 1, 2027)
- Price at analysis: $3.39
- Price target: $3.60
- Expected range: $3.15 – $3.75
- Result: Pending — graded after the close on Jan 1, 2027
Get a free AI analysis of NIO today
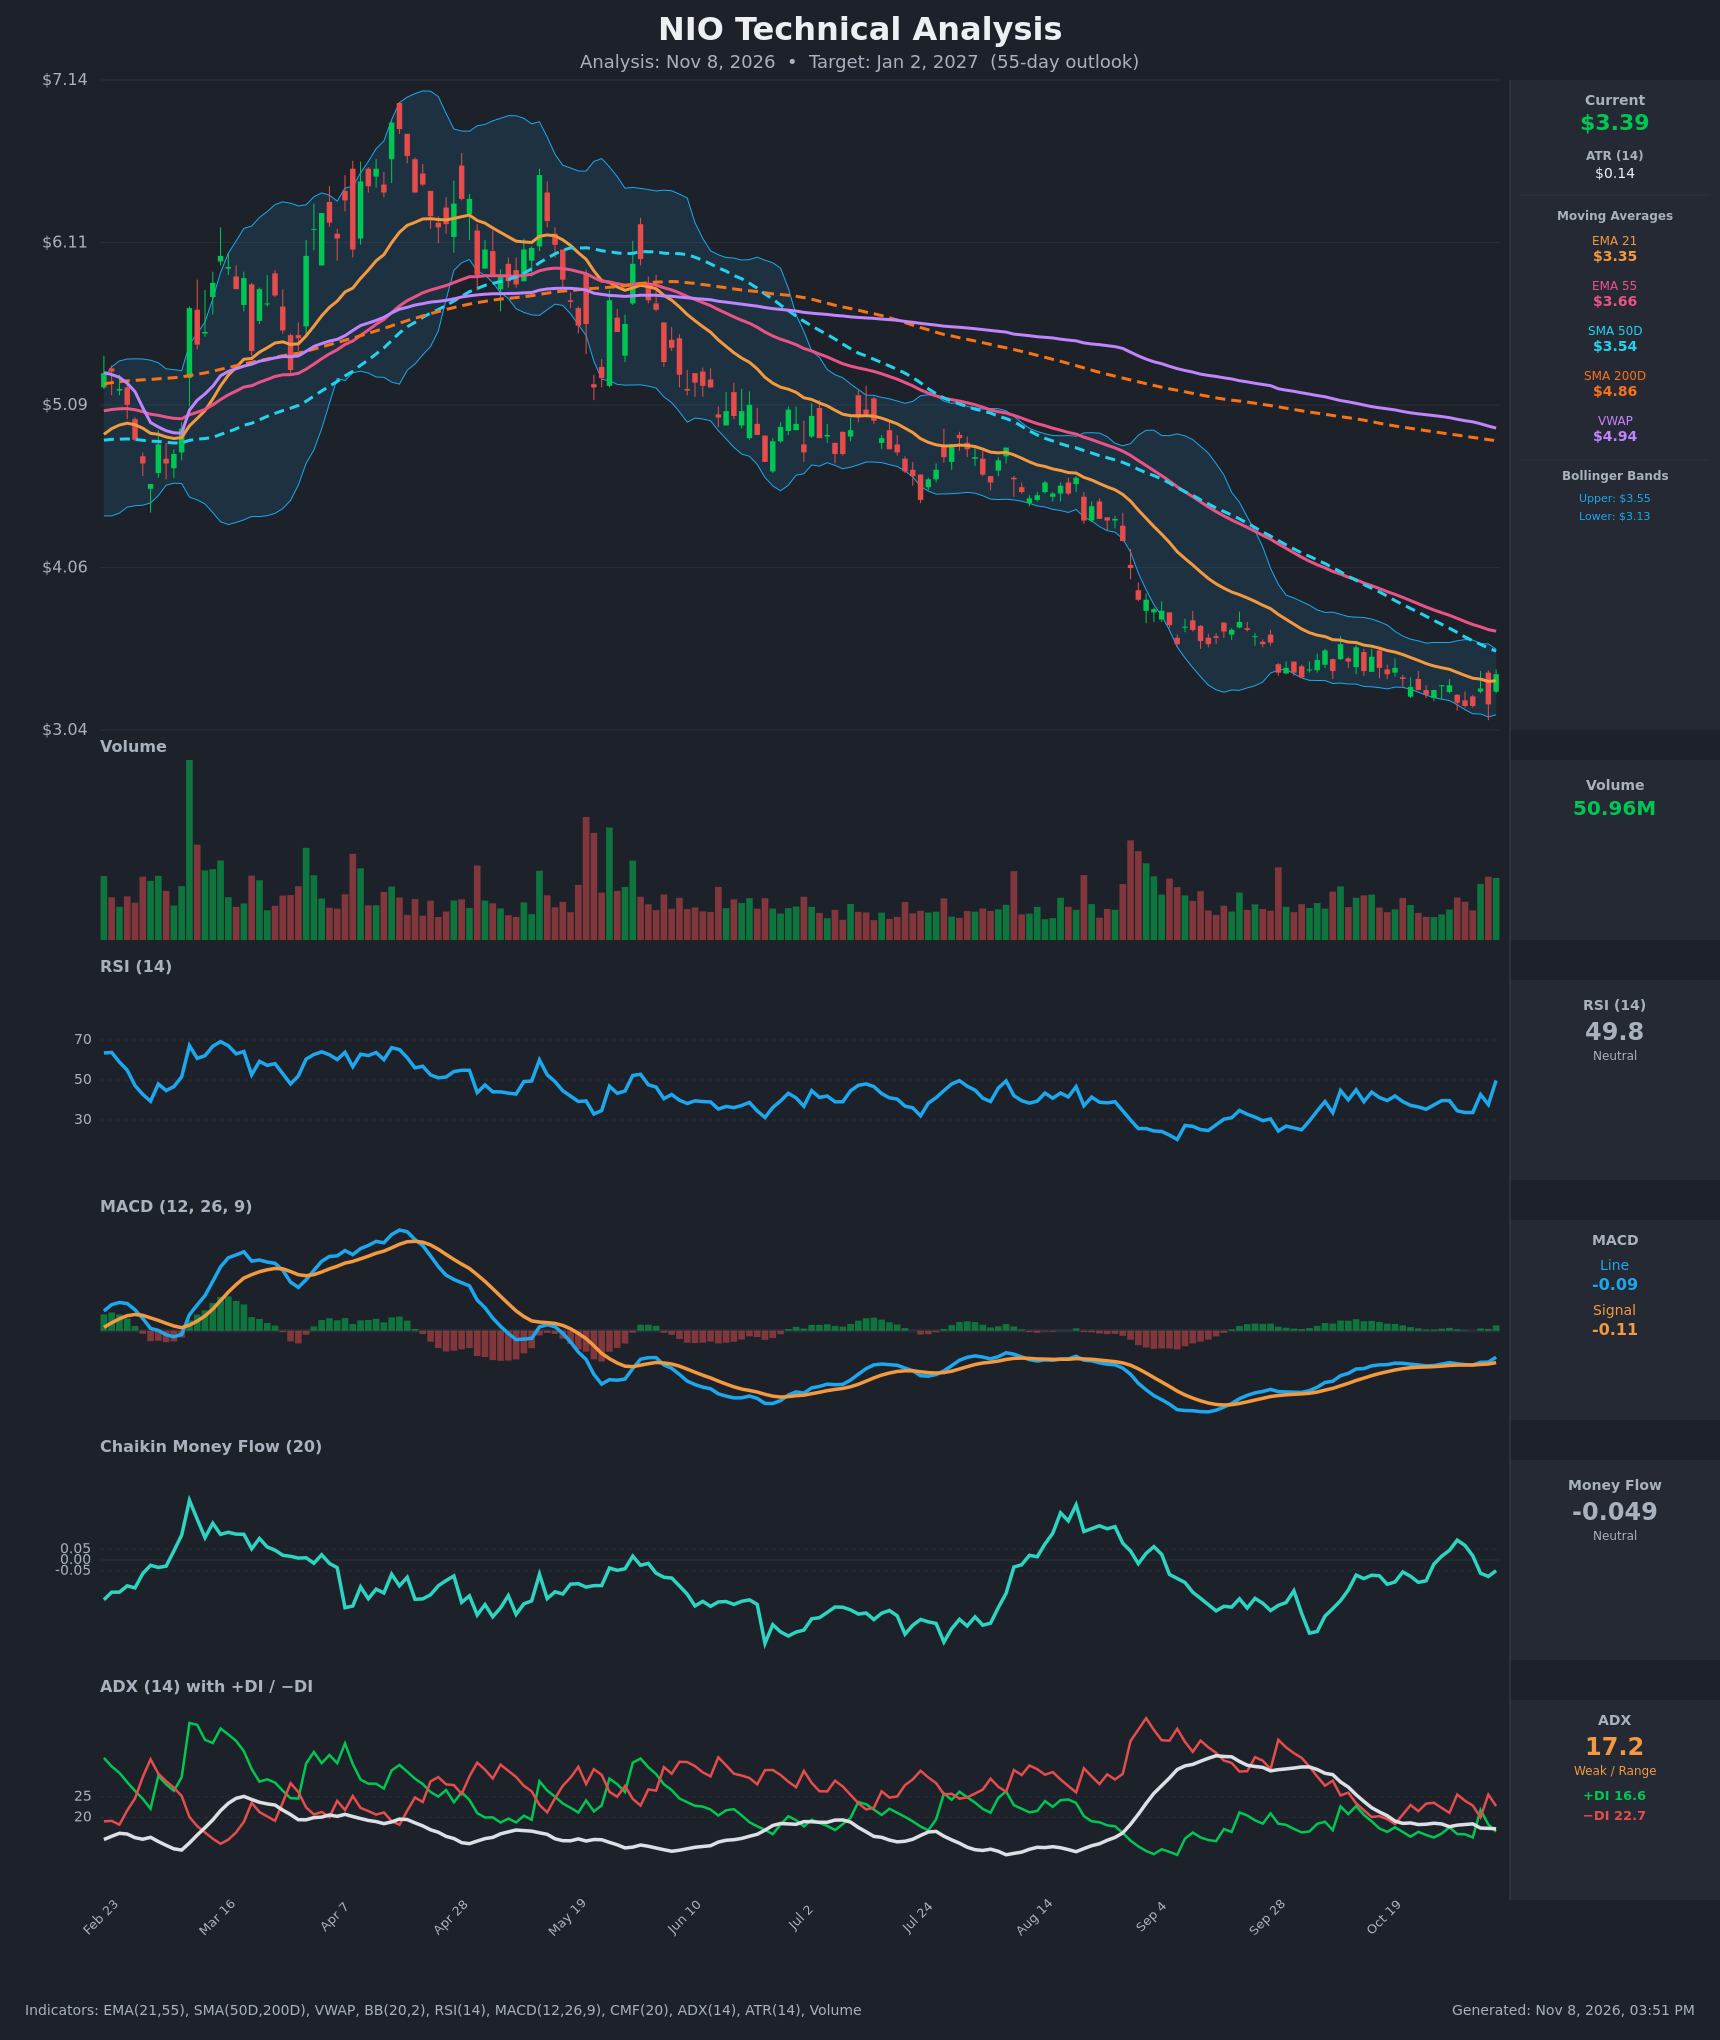
Analysis
TECHNICAL INDICATORS
- RSI (14): 49.76, a sharp rebound from 33.7 just three sessions earlier. It is back at the midline after sitting in the 33-40 zone for most of the past three weeks. Price made a lower low (~$3.19) but RSI troughs were roughly flat to slightly higher (33.7 vs. 34.6 and 35.4), a mild bullish divergence. [Neutral]
- 20 EMA (EMA 21: $3.3487): Price at $3.39 has just reclaimed the EMA 21 after trading below it for most of the past 15 bars. This is the first close above it in weeks and gives short-term support. EMA 55 ($3.66) and SMA 50D ($3.54) remain overhead and are falling. [Bullish]
- MACD: Line -0.0899 is above Signal -0.1083 after crossing up on Nov 4, so the histogram is positive and rising. The crossover is bullish, but both lines are still below zero, so it only signals a relief bounce within a larger downtrend. [Bullish]
- Bollinger Bands (20): Upper $3.5477, lower $3.1343, middle ~$3.34. Price is just above the midline after bouncing off the lower band, and the bands are narrow, which points to a volatility squeeze after the long decline. A move toward the upper band (~$3.55) is the natural first test. [Neutral]
- CMF (20): -0.049, just inside the neutral zone. It was positive (up to +0.09) in late Oct and has rolled over to the distribution threshold. Money flow is not clearly supporting the bounce yet. [Neutral]
- ADX (14): 17.2 with −DI (22.7) above +DI (16.6). ADX is below 20 and falling, so the trend is weak and the market is range-bound or basing. Bears still hold directional edge, but it is fading from the Sep peak. [Weak Trend, bearish lean]
- Volume: 50.96M on the latest green bar, the highest of the recent bars and above the average of the past several weeks. The bounce came on expanding volume, which suggests real buying interest at the $3.20 lows, though one bar is not confirmation. [Mildly Bullish]
DIVERGENCES & TRENDS
- Long-term trend: Bearish. Price is below SMA200D ($4.86), VWAP ($4.94), EMA 55 ($3.66) and SMA 50D ($3.54). The death cross (SMA50D below SMA200D) is long established, and EMA21 is below EMA55.
- Mild bullish RSI divergence: Price made lows near $3.19-$3.20 while RSI held in the mid-30s rather than making new lows. This is a mild divergence, not a strong one.
- MACD: It bottomed in mid-Sep and has been climbing steadily, with a fresh bullish cross on Nov 4. Momentum is improving while price is flat, which is constructive.
- ADX: It has dropped from ~35 in Sep to 17.2, so the downtrend has lost strength and price is consolidating.
- −DI above +DI: Bears still hold control, so this is a bounce within a downtrend until proven otherwise.
- Price vs. EMA21: The Nov 6 close back above EMA21 is the first short-term trend improvement in weeks.
CHART PATTERNS
- Bullish Double Bottom (reversal): Lows at ~$3.19 (Nov 2-3) and ~$3.20 (Nov 5) form a small double bottom. The neckline is around $3.40-$3.43, and the Nov 6 close of $3.39 sits just below it. A close above ~$3.43 would project a measured move of roughly $0.20-$0.25 (to ~$3.65).
- Bullish Falling Wedge / base (reversal): After the multi-month decline from $7, price has formed a tightening base between ~$3.19 and ~$3.55 with compressing Bollinger Bands. This resembles a falling wedge or basing structure, though the larger structure remains a downtrend and the pattern is not yet confirmed.
- Overhead resistance: The cluster of SMA50D ($3.54), the upper Bollinger Band ($3.55) and EMA55 ($3.66) is a heavy supply zone and the likely cap on the first rally.
POTENTIAL SCENARIOS
- Scenario 1: Bullish Base Breakout and Relief Rally — The double bottom and MACD cross extend into a mean-reversion rally toward the falling SMA50D/EMA55 cluster. Trigger: daily close above ~$3.43 followed by a move through $3.55 on above-average volume. Target: $3.60-$3.66 (EMA55), with an extension to ~$3.85 if momentum builds. Invalidation: daily close below $3.19. (45% probability)
- Scenario 2: Bearish Downtrend Resumption — The bounce stalls under the falling moving averages, −DI stays on top and CMF slides into distribution, leading to a new low below the $3.19 base. Trigger: rejection at $3.50-$3.55 and a close below $3.19. Target: $3.05-$3.10, with a possible extension to ~$2.90. Invalidation: daily close above $3.66. (35% probability)
- Scenario 3: Neutral Range Chop — Low ADX keeps price oscillating between $3.20 and $3.55 through the period. Trigger: repeated failures at both the $3.55 and $3.19 boundaries. Target: ~$3.35-$3.45. Invalidation: a close outside the $3.15-$3.66 band. (20% probability)
PRICE TARGETS
For the 55-day timeframe (to ~Jan 2, 2027):
- Target Price: $3.60
- Expected Range: $3.15 to $3.75 (width $0.60 = ~17.7% of current price, consistent with the 30-60 day guidance)
- Key Levels: Support at $3.19, Resistance at $3.54
OVERALL BIAS
OVERALL BIAS: BULLISH - A double bottom near $3.19, a fresh bullish MACD crossover, RSI recovering to 50, price reclaiming the EMA 21 and a volume expansion on the bounce favor a relief rally toward the $3.54-$3.66 moving-average cluster. Conviction is modest because the long-term trend is still down, −DI is above +DI, and heavy overhead resistance could cap gains.
This is educational analysis and not financial advice.