ARM 83-day bearish forecast — Nov 8, 2026
- Bias: Bearish
- Timeframe: 83 days (made Nov 8, 2026, target date Jan 29, 2027)
- Price at analysis: $174.62
- Price target: $158.00
- Expected range: $136.00 – $186.00
- Result: Pending — graded after the close on Jan 29, 2027
Get a free AI analysis of ARM today
Analysis
TECHNICAL INDICATORS
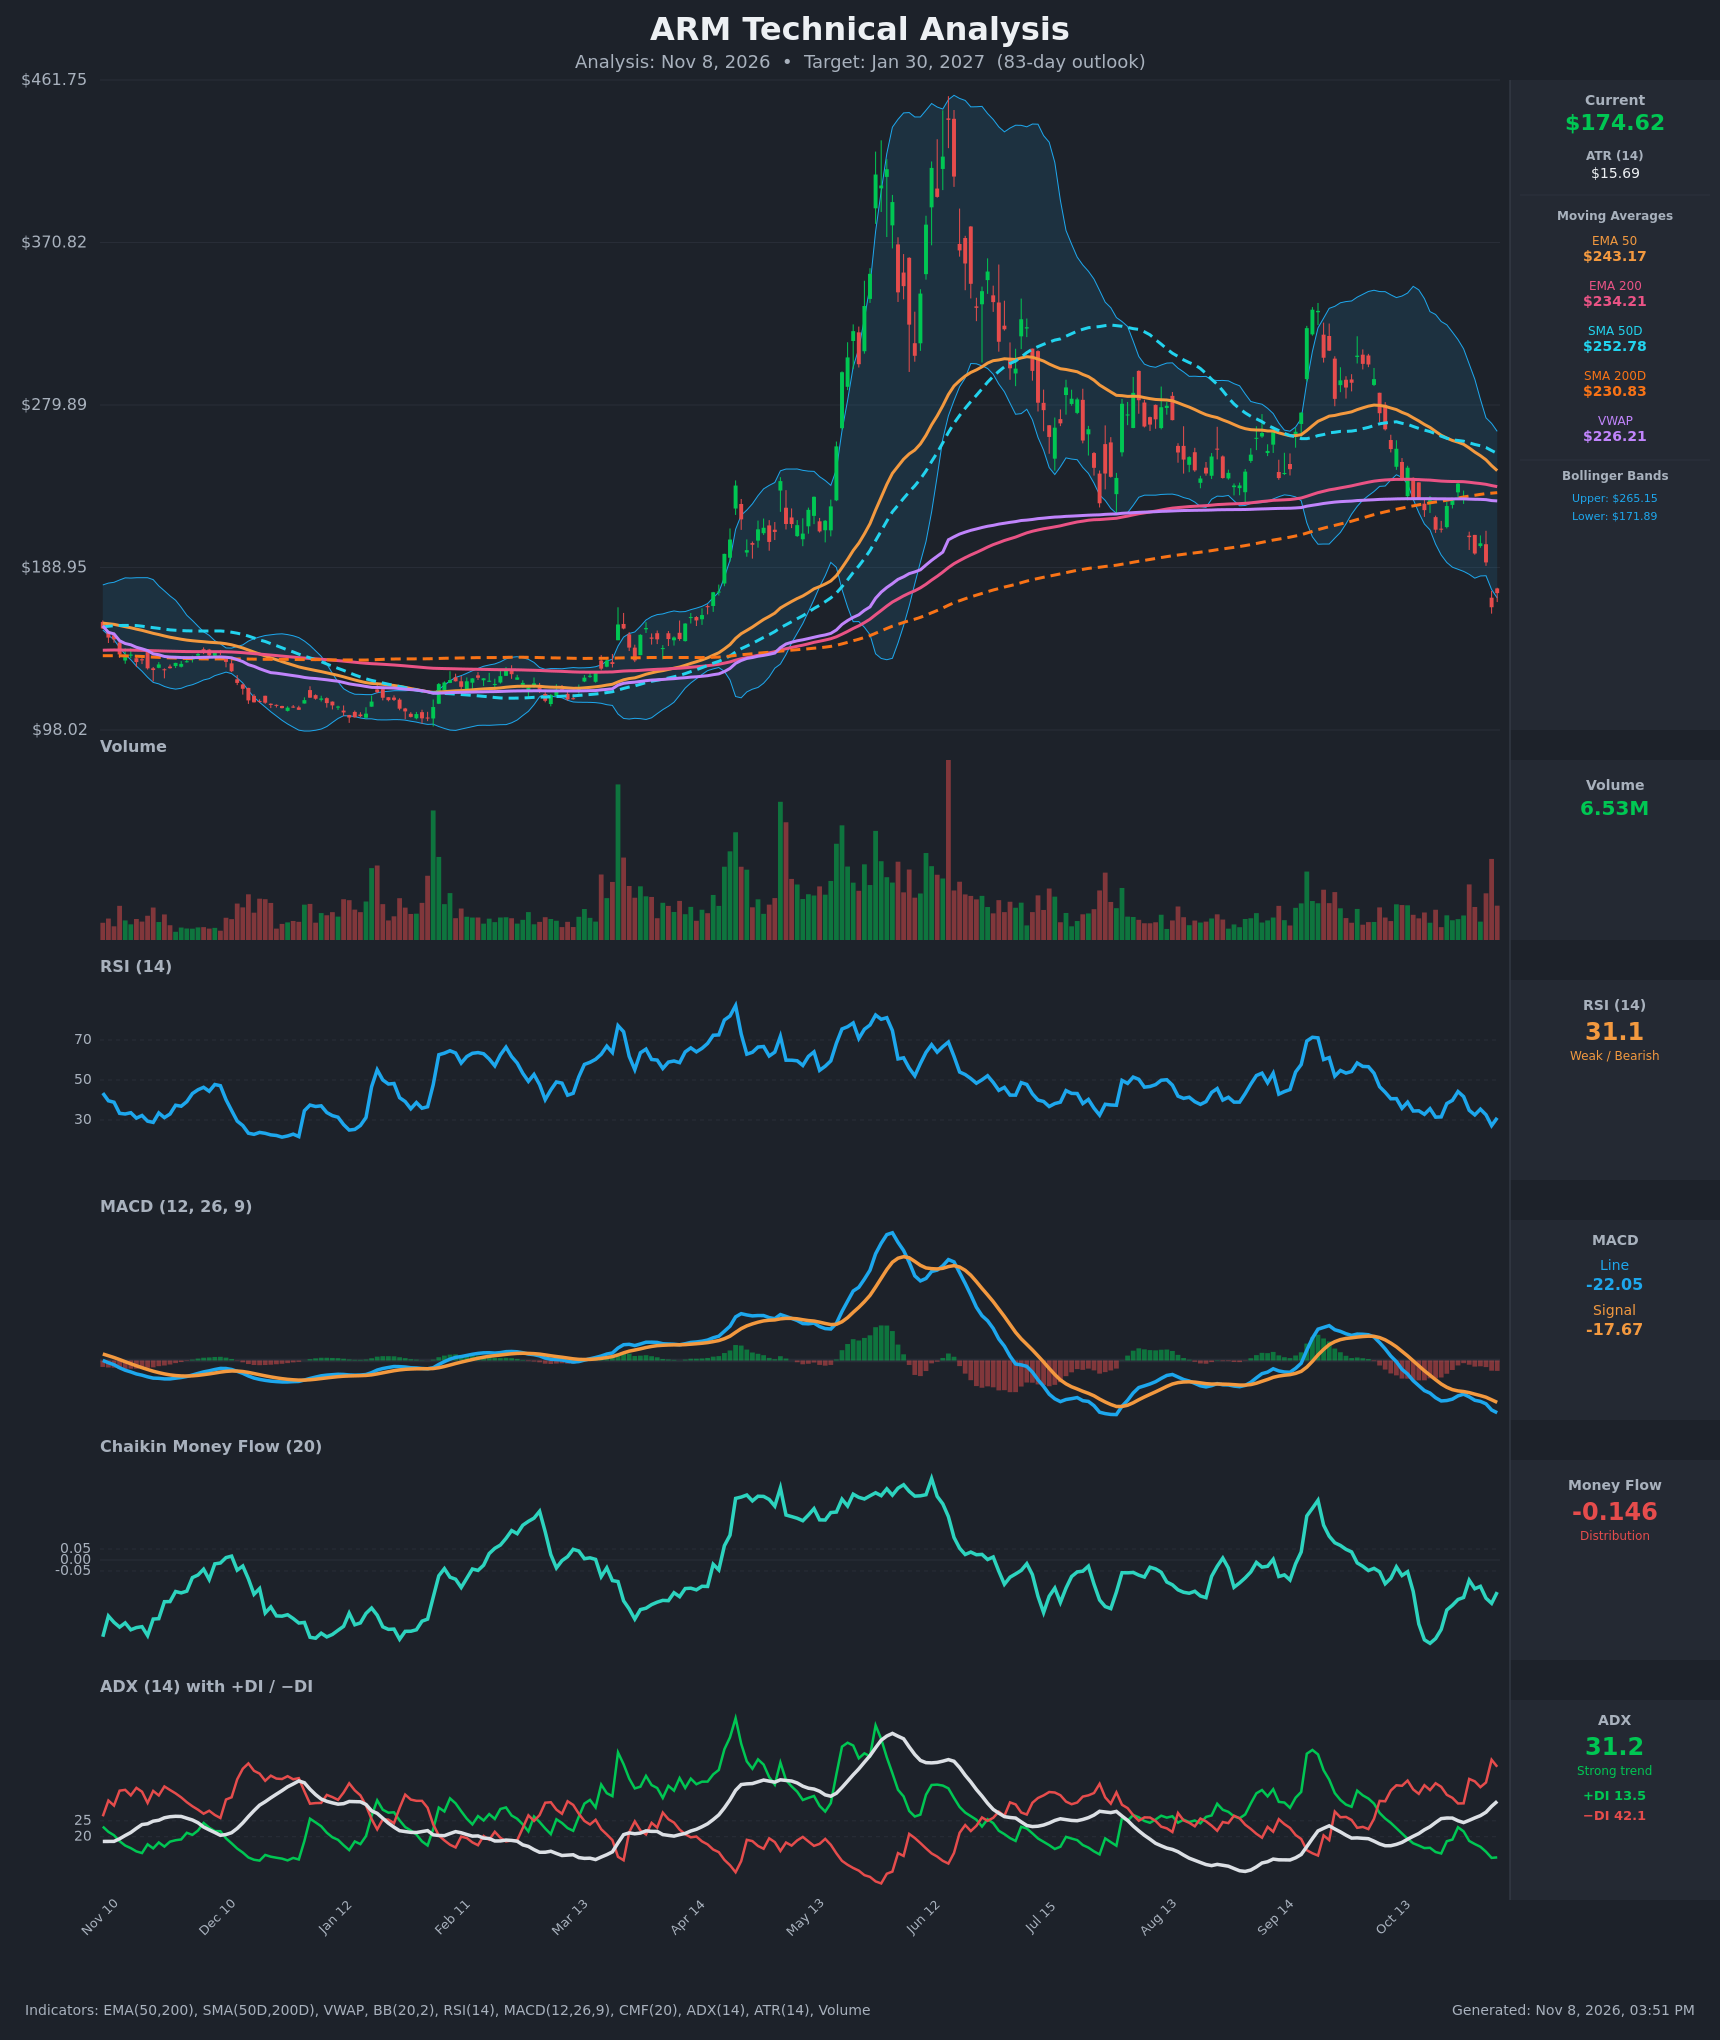
- RSI (14): 31.08, just above oversold. It made a lower low of 27.2 on Nov 5 and bounced slightly. Momentum has been weak for months, and the RSI has not been above 50 since the September rally failed. [Bearish]
- 20 EMA: No 20 EMA value was provided, so I use the EMA 50 ($243.17) and EMA 200 ($234.21) instead. Price at $174.62 is about 28% below the EMA 50 and 25% below the EMA 200, and both are sloping down. The EMA 50 is converging on the EMA 200, which points toward a bearish EMA crossover. [Bearish]
- MACD: The line (-22.05) is below the signal (-17.67) and below zero. It has been under the signal since Oct 19, and the histogram of about -4.4 is widening. The line is at a new low, so there is no bullish crossover in sight. [Bearish]
- Bollinger Bands (20): Price is $174.62 against a lower band of $171.89, an upper band of $265.15 and a midline near $218.5. Price is hugging the lower band after a band walk. The bands are wide, reflecting high volatility. This is a stretched condition that can give a relief bounce, but it is not a reversal signal on its own. [Bearish]
- CMF (20): -0.146, below the -0.05 threshold. It has been negative for the whole recent stretch (-0.09 to -0.38), so selling pressure is persistent. It is improving slightly from the -0.38 low but remains in distribution. [Distribution]
- ADX (14): 31.2 and rising (21 to 31 over the last 15 bars), with -DI at 42.1 far above +DI at 13.5. This is a strong, accelerating downtrend with the bears firmly in control. [Strong Trend – Bearish]
- Volume: 6.53M, with larger red volume bars on the recent breakdown legs and no clear capitulation spike like the one seen at the June top. Selling has been orderly rather than climactic, so a final washout may not be complete. [Bearish / Neutral-to-bearish]
DIVERGENCES & TRENDS
- There is no bullish RSI divergence. RSI made a lower low (27.2) as price made a lower low ($166.72 close), which confirms the weakness.
- MACD is making new lows and shows no divergence.
- The SMA 50 ($252.78) is still above the SMA 200 ($230.83), but the gap has narrowed from about $42 to $22 in 15 bars. A death cross is plausible within the next several weeks.
- The EMA 50 ($243.17) is falling toward the EMA 200 ($234.21). A bearish crossover looks likely within the 83-day window.
- Price has lost the SMA 200 (the long-term uptrend is broken), the VWAP ($226.21) and the 215–220 zone that held in July and August.
- Price has made lower highs since the June peak near $440 (about $330 in September) and is now making lower lows.
- The Nov 5 flush (-13%) followed by a +4.7% bounce on Nov 6 is a first relief attempt, but it is below every resistance level.
CHART PATTERNS
- The structure loosely resembles a Bearish Head and Shoulders: a June head near $440, a lower right shoulder near $330 in September, and a neckline around $215–220 that gave way in October. The measured move is very large and unrealistic over 83 days, but the pattern confirms the bearish bias.
- The July–October floor near $215 also resembles a Descending Triangle (lower highs against flat support). The breakdown targets the next base area.
- The next major support is the April–May consolidation and breakout zone around $150–$165, with the deeper base at $100–$130.
- Resistance sits at the old support area of $190–$220, now a supply zone.
POTENTIAL SCENARIOS
- Scenario 1: Bearish Trend Continuation — The ADX and -DI trend persists, with price walking the lower band and probing the April-May breakout zone. Trigger: a daily close below $166.72 (the Nov 5 low close). Target: $140–$158. Invalidation: a daily close above $192 with MACD turning up. (50% probability)
- Scenario 2: Bullish Oversold Relief Rally — RSI near 30 and price at the lower Bollinger Band produce a mean-reversion bounce. The rally stalls below the falling EMAs and VWAP. Trigger: a hold above $166 and an RSI move above 40. Target: $200–$215, with the 50-day lines far overhead. Invalidation: a close below $160. (35% probability)
- Scenario 3: Neutral Basing Range — Price stabilizes between roughly $150 and $190 as selling exhausts, with ADX fading. Trigger: lower volatility and CMF rising toward zero. Target: $165–$180. Invalidation: a close outside the $150–$190 range. (15% probability)
PRICE TARGETS
- Target Price: $158.00 (83-day horizon, Jan 30, 2027)
- Expected Range: $136.00 to $186.00 (width $50 = about 28.6% of current price, consistent with the 61–180 day guidance of 18–30%)
- Key Levels: Support at $150.00 (April–May breakout zone), Resistance at $192.00 (Nov 4 close and breakdown area)
OVERALL BIAS
OVERALL BIAS: BEARISH - ADX of 31 and rising with -DI at 42 vs +DI at 13.5, price below every moving average and VWAP, MACD below the signal and falling, and persistent CMF distribution outweigh the near-oversold RSI. The EMA and SMA crossovers also point to further downside, though a relief bounce is possible.
This is educational analysis and not financial advice.