GLD 83-day bearish forecast — Nov 8, 2026
- Bias: Bearish
- Timeframe: 83 days (made Nov 8, 2026, target date Jan 29, 2027)
- Price at analysis: $372.52
- Price target: $361.00
- Expected range: $332.00 – $402.00
- Result: Pending — graded after the close on Jan 29, 2027
Get a free AI analysis of GLD today
Analysis
TECHNICAL INDICATORS
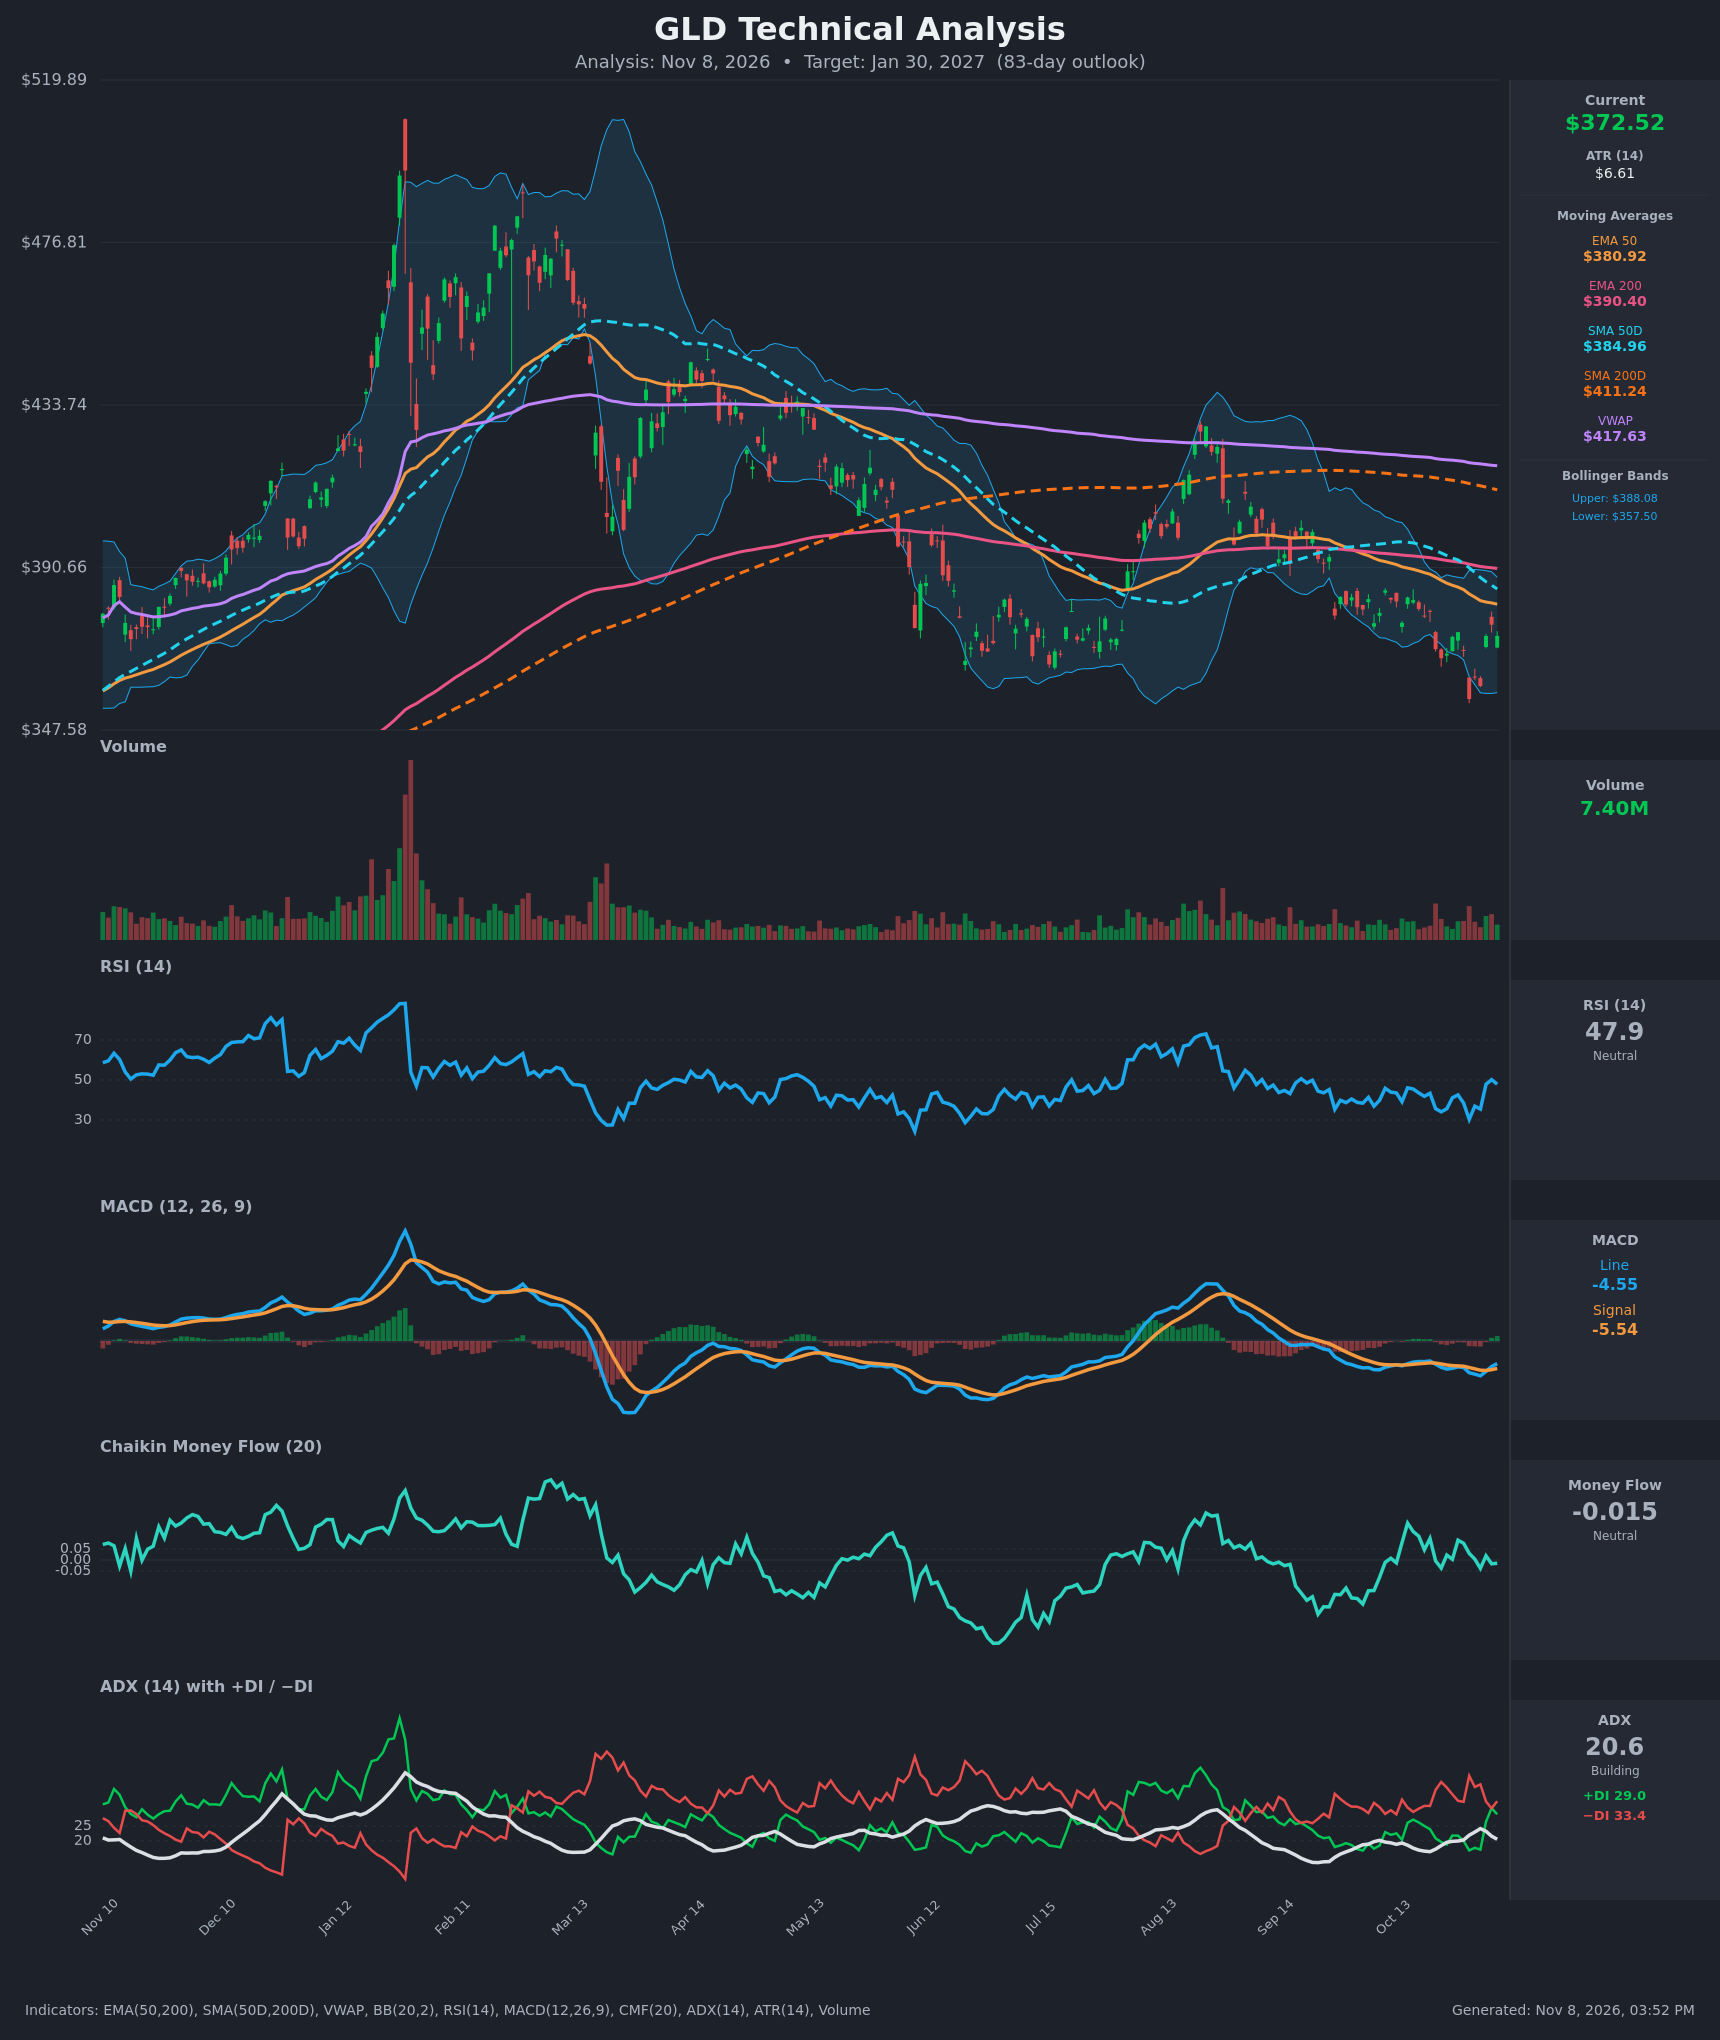
- RSI (14): 47.9, neutral. It has recovered from 30.3 on Oct 30 and briefly touched 50.2 on Nov 5 before turning back down. Across the year RSI has made lower highs, and the last rally failed near 72 in August. [Neutral]
- 20 EMA: The 20 EMA isn't supplied, so I use the EMA 50 at $380.92 as the nearest dynamic reference. Price at $372.52 is below it, so it acts as resistance. The EMA 50 is also below the EMA 200 ($390.40), a bearish alignment, and price is below the EMA 200 as well. [Bearish]
- MACD: Line -4.55 vs signal -5.54, so the histogram is about +0.99. The line crossed above the signal on Nov 5, a bullish crossover and a rising histogram. Both lines remain below zero, so this is only a relief bounce inside a bearish regime. [Neutral]
- Bollinger Bands (20): Upper $388.08, lower $357.50, midline about $372.8. Price sits right on the midline after bouncing from the lower band on Oct 30 ($355.78 close), which was a close below the band. The bands are fairly narrow compared with the January–March expansion, so volatility is moderate. [Neutral]
- CMF (20): -0.015, inside the ±0.05 neutral zone. It has hovered around zero for weeks, with no accumulation or distribution trend. [Neutral]
- ADX (14): 20.6, falling from 24.1 on Nov 3, with −DI 33.4 above +DI 29.0. Bears hold a small edge but trend strength is weak. +DI jumped from 17 to 29 on the Nov 4 bounce and the gap is narrowing, so a +DI/−DI crossover is possible. [Weak Trend, Bearish lean]
- Volume: 7.40M, below the January–March spikes and in line with the quiet recent averages. The Oct 30 selloff and Nov 4 rebound did not come with outsized volume, so neither side shows strong conviction. [Neutral]
Other long-term structure:
- Price is below the SMA 200 ($411.24), the SMA 50 ($384.96), and VWAP ($417.63).
- The SMA 50 is far below the SMA 200, so the death cross is in force.
- The SMA 200 is rolling over.
[Bearish]
DIVERGENCES & TRENDS
- MA structure: Every moving average is stacked above price in bearish order: price < EMA50 < SMA50 < EMA200 < SMA200 < VWAP. The trend since the January–March peak (~$520) has been a series of lower highs: about $440 in spring, about $433 in August, then the failed push near $395.
- Failed rally: The August rally stalled at the falling SMA 200 and VWAP, and price rolled over. The highs are falling.
- MACD: The Nov 5 bullish crossover is a short-term positive, but the histogram is tiny and sits below the zero line. In earlier cycles, crossovers below zero (such as April–July) produced only weak bounces.
- RSI: There is no clear bullish divergence. Price made a lower low on Oct 30 (RSI 30.3), but RSI's earlier low was also near 30, so the signal is only marginal. Momentum is simply basing.
- ADX/DI: ADX is below 25, so the trend is not strong. −DI remains on top, but +DI is catching up, which is a mild warning for bears.
- EMA/SMA: There is no new crossover; the bearish crosses are already in place and the gaps are slowly widening.
CHART PATTERNS
- Descending Triangle (bearish continuation): Lower highs from August (~$433) to now, against horizontal support at roughly $355–$362 (June/July lows and the Oct 30 low). A close below ~$355 would confirm a breakdown. The measured move is the triangle height (~$75) projected down, which points to the low-$280s, well beyond a realistic 83-day target. I haircut this to a $330–$340 area.
- Broad top / lower-highs structure: The January–March blow-off peak followed by lower highs resembles a Bearish Head and Shoulders / rounded top on the larger scale. The neckline zone of ~$355–$360 matches the descending triangle support.
- Counter-view: The Oct 30 bounce held above the lower band and the MACD crossover could be the start of a Bullish Double Bottom (lows ~$362 in July and ~$355 in Oct). It needs a close above ~$395 to confirm, so it is currently the less likely read.
POTENTIAL SCENARIOS
- Scenario 1: Bearish Breakdown Below Range Support — Price fails at the EMA 50 and the falling SMA 50, then rolls over as −DI strengthens and ADX rises above 25. Price breaks the $355 support, aiming for the low-to-mid $330s. Trigger: daily close below $355.78 on rising volume. Target: $335–$345, with an extension toward $330. Invalidation: close above $390 (upper Bollinger Band / EMA 200). (45% probability)
- Scenario 2: Neutral Range Chop — Price stays between $355 and $390 for most of the period, consistent with the weak ADX and neutral CMF. Trigger: failed breaks of both $355 and $390. Target: $360–$380. Invalidation: decisive close outside the $355–$390 range. (25% probability)
- Scenario 3: Bullish Relief Rally — The MACD crossover follows through, +DI crosses above −DI, and price reclaims the EMA 50 and SMA 50. Price tests the EMA 200 and the falling SMA 200 area. Trigger: close above $385 with CMF above +0.05. Target: $400–$411. Invalidation: close back below $355. (30% probability)
PRICE TARGETS
- Target Price: $361.00 (83-day horizon, about -3.1% from current)
- Expected Range: $332.00 to $402.00 (width $70, about 18.8% of current price, consistent with the 61–180 day guidance)
- Key Levels: Support at $355.78 (Oct 30 closing low), Resistance at $380.92 (EMA 50, with the SMA 50 just above at $384.96)
OVERALL BIAS
OVERALL BIAS: BEARISH - Price is below every major moving average, the death cross is intact, −DI still leads +DI, and the August rally failed at falling resistance, forming lower highs against support near $355. The recent MACD crossover and neutral CMF make this a modest-conviction call, since a relief rally toward $385–$395 is possible first.
This is educational analysis and not financial advice.