IREN 83-day bearish forecast — Nov 8, 2026
- Bias: Bearish
- Timeframe: 83 days (made Nov 8, 2026, target date Jan 29, 2027)
- Price at analysis: $21.64
- Price target: $19.80
- Expected range: $16.80 – $23.30
- Result: Pending — graded after the close on Jan 29, 2027
Get a free AI analysis of IREN today
Analysis
TECHNICAL INDICATORS
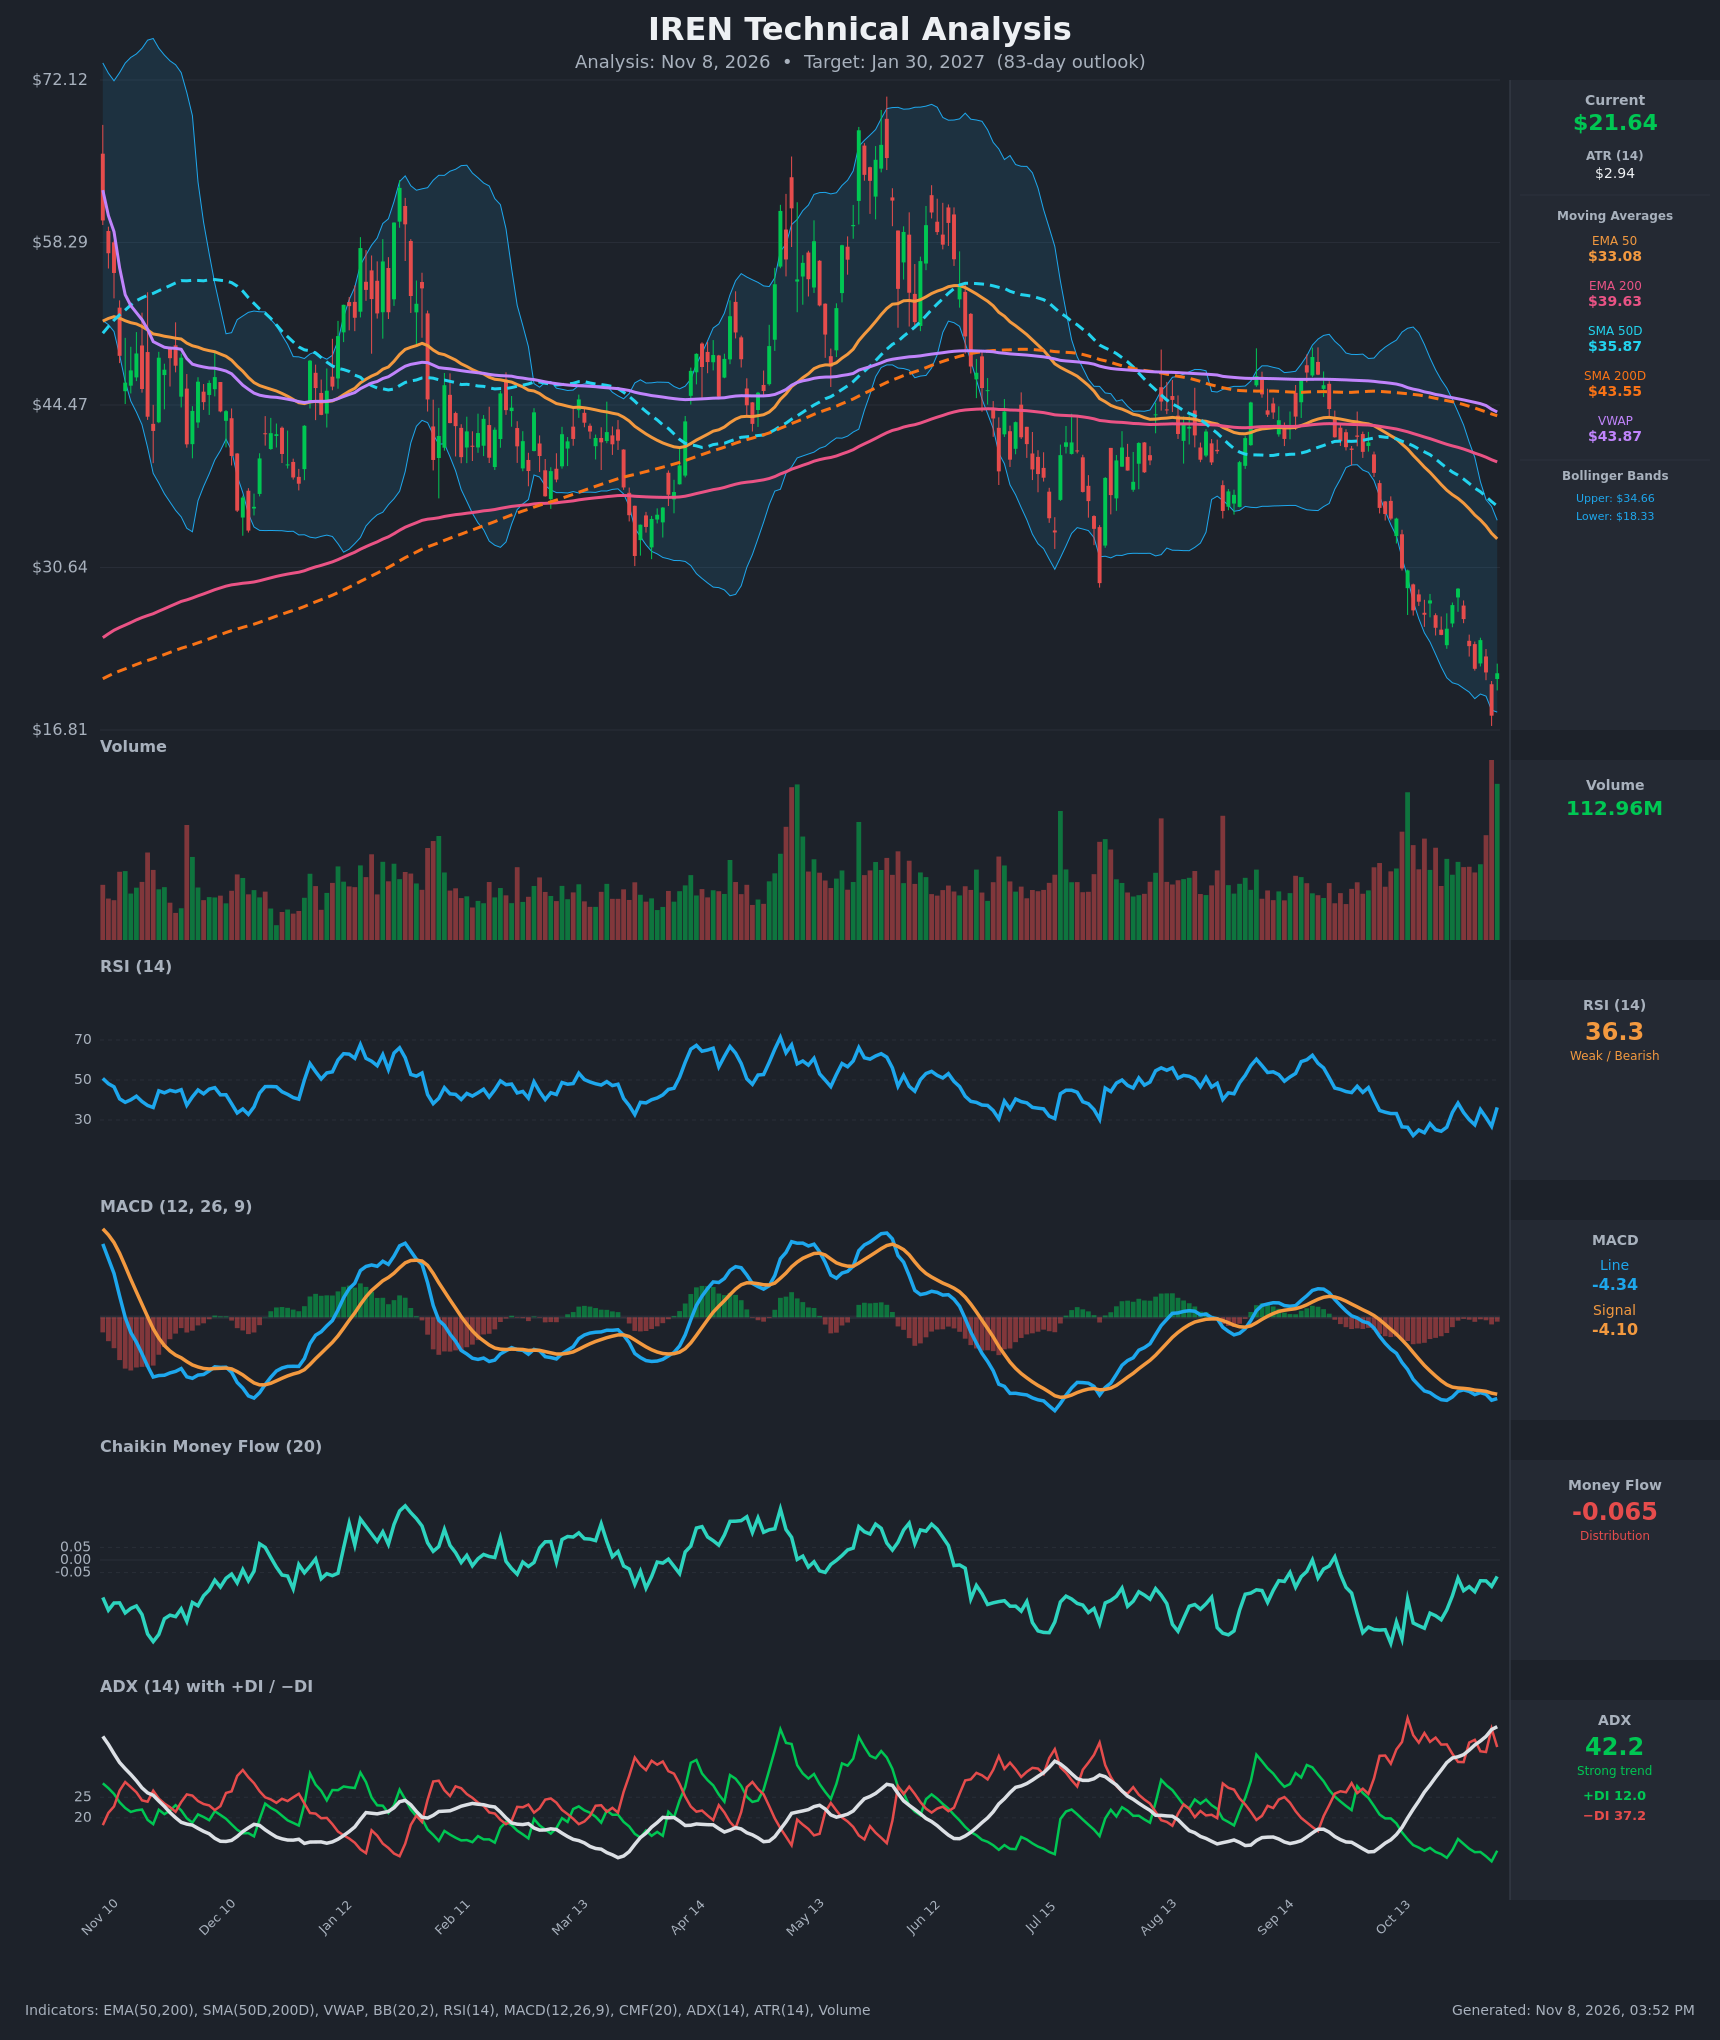
- RSI (14): 36.29, up from a 26.8 low on Nov 5 and 23.6 on Oct 20. It is bouncing from oversold but still below 40 and has not reclaimed 50, which is the bear-market ceiling. [Bearish]
- 20 EMA: The 20 EMA is not supplied. The nearest reference, the EMA 50 at $33.08, sits about 53% above price, and the EMA 50 is also well below the EMA 200 ($39.63). Price is far below every moving average, so they act as overhead resistance. [Bearish]
- MACD: Line -4.335 is below signal -4.103, with a histogram of about -0.23. The line is still below the signal after failed attempts to cross, though it has flattened in the -4.0 to -4.4 range and is not accelerating lower. It is a bearish setup with fading downside momentum. [Bearish]
- Bollinger Bands (20): Upper $34.66, lower $18.33, midline about $26.50. Price at $21.64 is in the lower third after a close of $18.03 that pierced the lower band. The bands are wide, which means high volatility. The bounce back inside the band is a relief move, not a confirmed reversal. [Bearish]
- CMF (20): -0.065, just below the -0.05 threshold. It has improved from -0.27 in late October, so selling pressure is easing but still shows net distribution. [Distribution]
- ADX (14): 42.2 and rising, with −DI at 37.2 well above +DI at 12.0. This is a very strong, mature downtrend with the bears fully in control. ADX above 40 can also mark an exhaustion zone. [Strong Trend – Bearish]
- Volume: 112.96M on the Nov 6 green bounce candle, among the heaviest volume on the chart, and the prior red day was similarly heavy. That pattern looks like capitulation or a selling climax. It supports a tradable relief bounce but does not yet confirm a bottom. [Capitulation / Possible Exhaustion]
DIVERGENCES & TRENDS
- Mild bullish RSI divergence: Price made a new low at $18.03 on Nov 5, but RSI (26.8) held above its October lows (23.6–25.0). MACD is also flattening instead of making new lows.
- Death cross is in place: SMA50D ($35.87) is below SMA200D ($43.55), and EMA50 ($33.08) is below EMA200 ($39.63). The gaps have kept widening, which is typical of an entrenched downtrend.
- Price vs. VWAP and SMA200D: Price is about 51% below VWAP ($43.87) and about 50% below the SMA200D. The long-term trend is down, and price is extremely stretched from its averages.
- No MACD bullish crossover yet: The line has stayed below the signal for the whole recent window.
- DI lines: −DI has been above +DI since early October, with no sign of a bullish DI crossover. ADX has climbed from 24 to 42 in 15 bars.
- Money flow: CMF has recovered from -0.27 toward -0.065 but has not turned positive.
CHART PATTERNS
- Primary structure: The chart broke down from a multi-month range of roughly $35–$44 into a steep, nearly vertical decline. This is closest to a bearish continuation. It resembles a bearish flag/descending channel from the reference diagram, with lower highs near $28.84 and $24.46 and lower lows ending at $18.03.
- Alternative reading: The decline of the last few weeks is contracting like a bullish falling wedge. A close above about $25–$26 would support a relief rally toward $30. This is not confirmed, because price has not broken a descending trendline on a closing basis.
- Targets: Bearish continuation points to a retest of $18.03 and a possible extension to about $16.80 (the chart's lower axis level). The bullish wedge or relief scenario targets the $26–$28 gap zone, where the late-October highs sit.
POTENTIAL SCENARIOS
- Scenario 1: Bearish Trend Continuation — The Nov 6 bounce fades as a dead-cat bounce below declining resistance, and price resumes the downtrend under the death cross with −DI dominant. Trigger: rejection at $24.50–$26, or a close below $18.03. Target: $18.00 to $16.80, with the 83-day target near $19.80. Invalidation: a daily close above $26.50 (the Bollinger midline). (45% probability)
- Scenario 2: Bullish Relief Rally / Base Formation — Capitulation volume and the RSI divergence lead to a multi-week bounce toward the falling averages. Trigger: a MACD bullish cross and CMF above +0.05, with a close above $25.50. Target: $27.00 to $30.00 (Bollinger midline, then EMA 50 near $33 as an extension). Invalidation: a close below $18.03. (35% probability)
- Scenario 3: Neutral Choppy Base — Price consolidates between $18 and $25 as selling exhausts but buyers lack the strength to reclaim the moving averages. Trigger: failure to break either $18.03 or $25.00 for several weeks. Target: $20–$23. Invalidation: a decisive break outside the $18–$25 range. (20% probability)
PRICE TARGETS
Timeframe: 83 days, about Jan 30, 2027.
Self-check: the range is $16.80 to $23.30, a width of $6.50, or about 30% of the $21.64 price. That is at the top of the 18–30% band for 61–180 days and fits the high volatility (ATR $2.94).
- Target Price: $19.80 (about 8.5% below current)
- Expected Range: $16.80 to $23.30
- Key Levels: Support at $18.03, Resistance at $24.50
OVERALL BIAS
OVERALL BIAS: BEARISH - ADX at 42 with −DI far above +DI, a death cross, price below all moving averages, MACD below its signal and CMF still in distribution outweigh the oversold bounce. The mild RSI divergence and capitulation-style volume raise the odds of a relief rally, but a bounce from here is more likely to stall below $25 than to reverse the trend.
This is educational analysis and not financial advice.