MSTR 83-day bearish forecast — Nov 8, 2026
- Bias: Bearish
- Timeframe: 83 days (made Nov 8, 2026, target date Jan 29, 2027)
- Price at analysis: $128.93
- Price target: $119.00
- Expected range: $105.00 – $137.00
- Result: Pending — graded after the close on Jan 29, 2027
Get a free AI analysis of MSTR today
Analysis
TECHNICAL INDICATORS
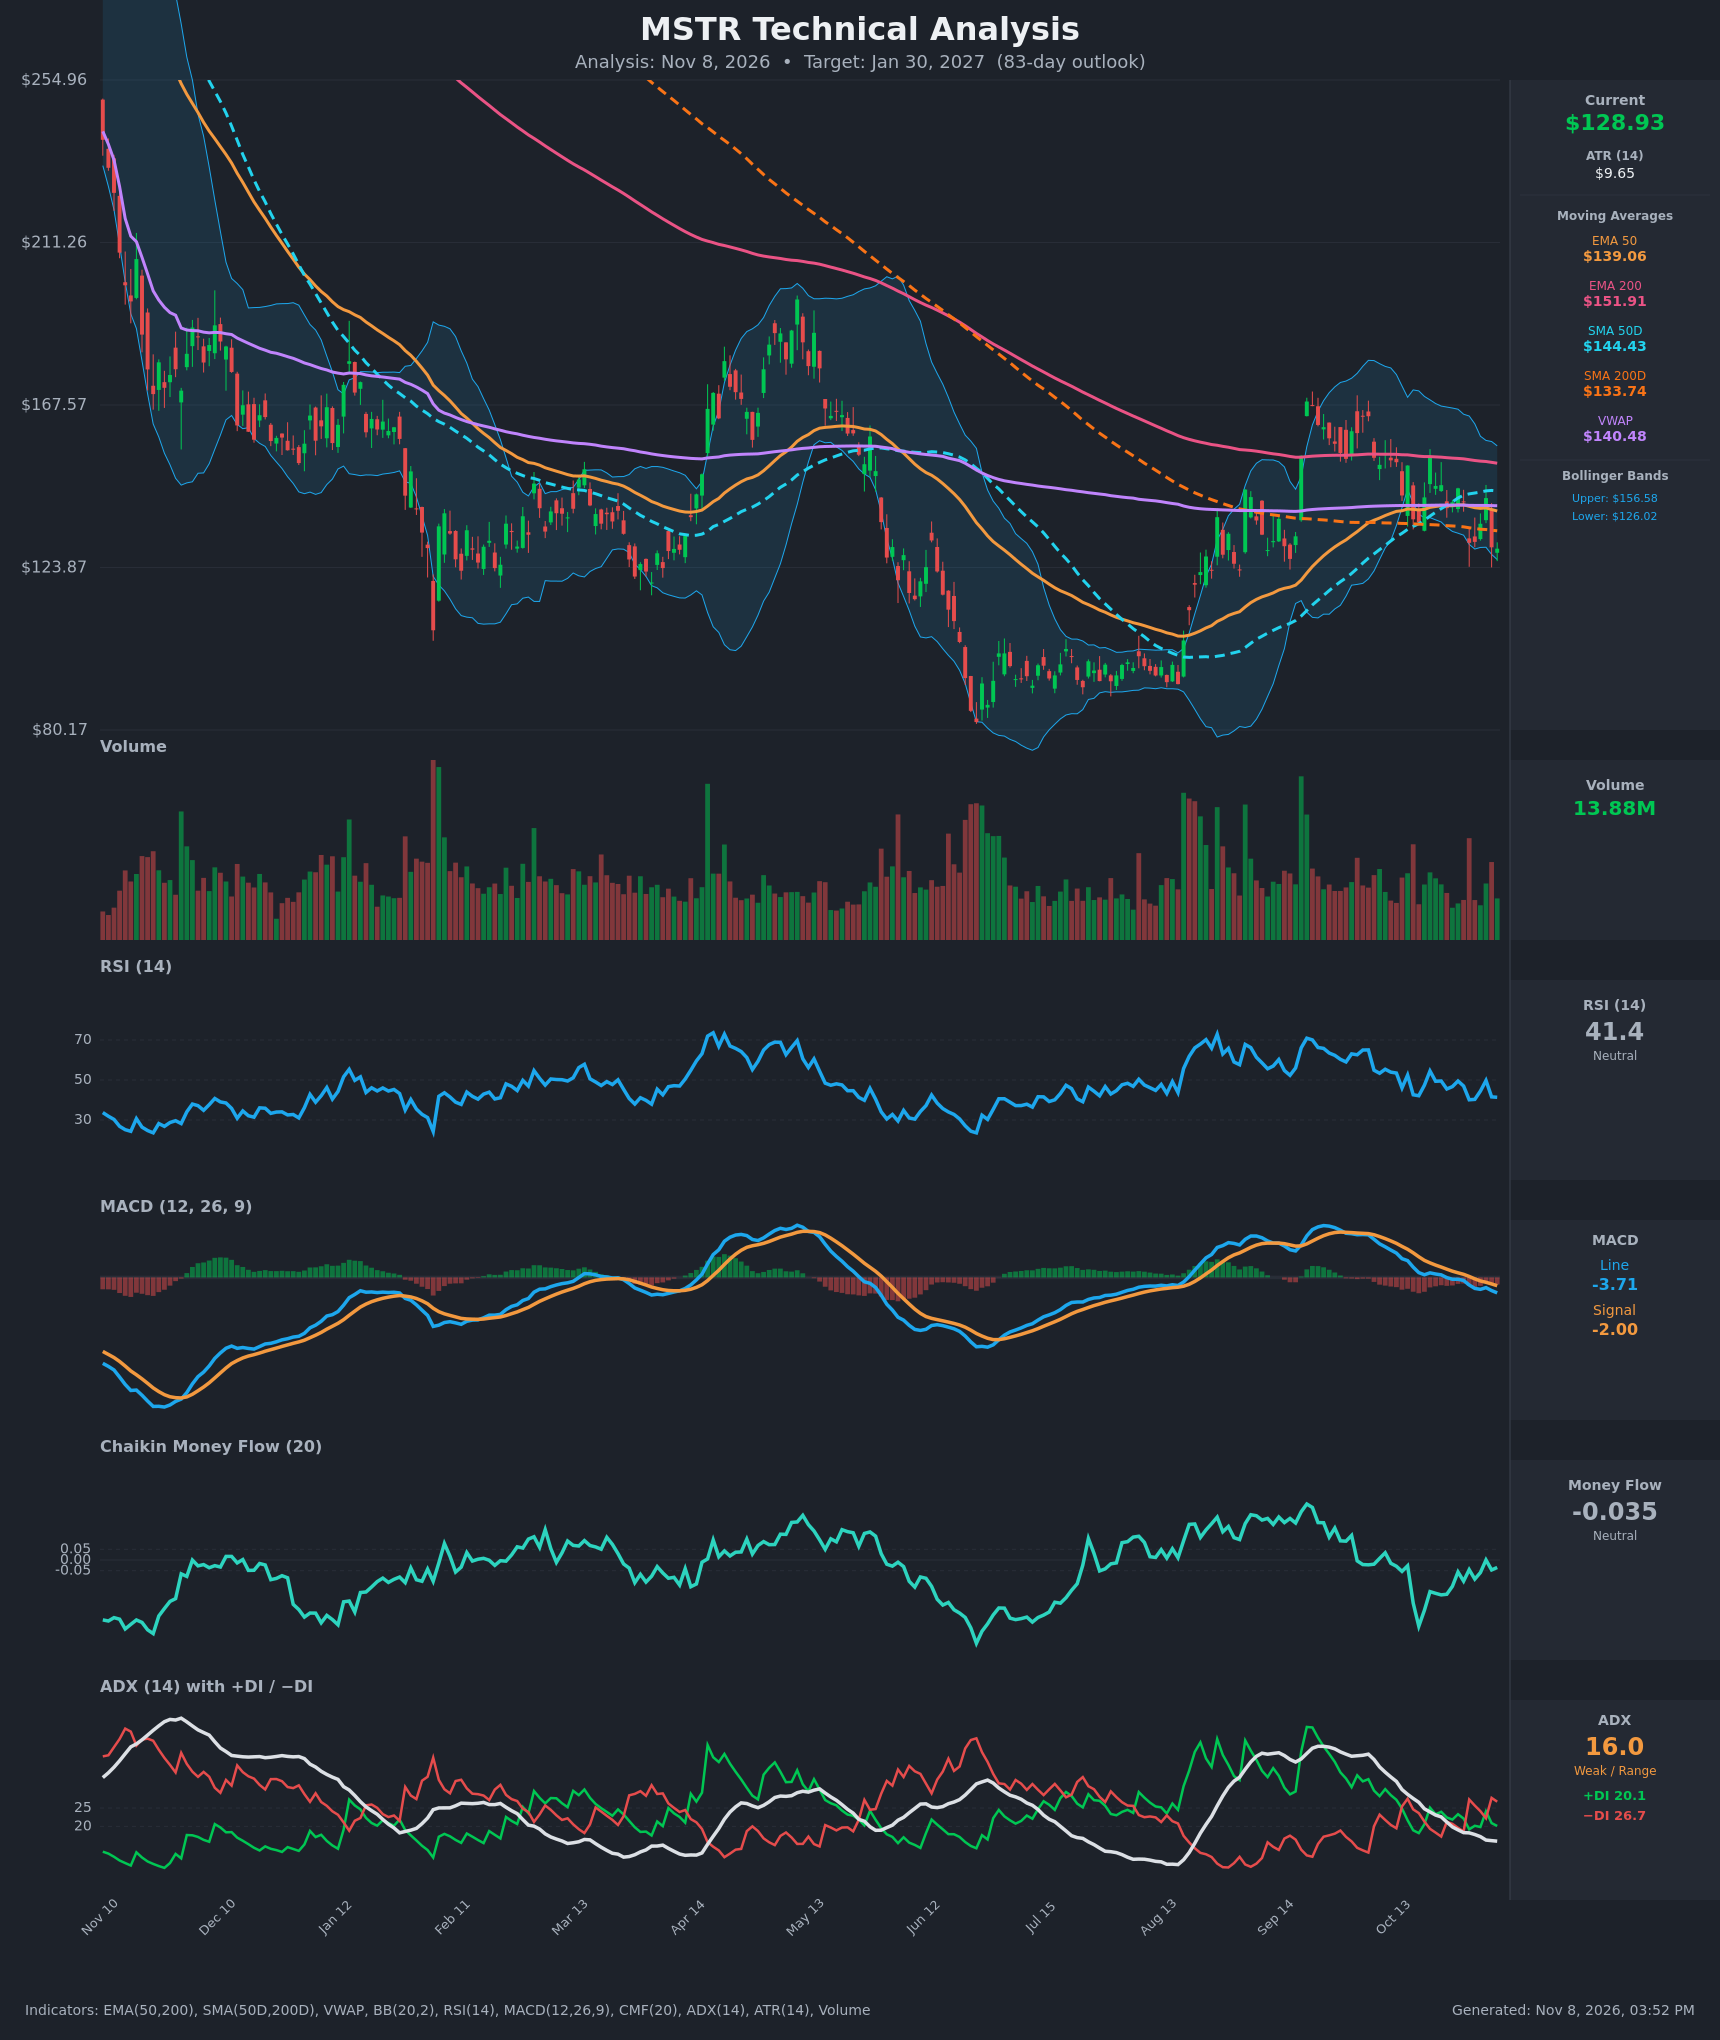
- RSI (14): 41.35, below the 50 midline but not oversold. It has made lower highs (about 54 on Oct 21, 49.7 on Nov 4) and is now rolling over again, so momentum is fading with room left to fall before 30. [Bearish]
- 20 EMA: No 20 EMA value was supplied, so I use the EMA 50 at $139.06 as the proxy. Price at $128.93 is about 7% below it, and it is flattening and turning down. EMA 200 ($151.91) is far overhead, and EMA50 < EMA200 is a bearish structure. [Bearish]
- MACD: Line -3.71 is below Signal -2.00 and both are below zero. The bearish crossover happened around Oct 30-Nov 2, and the negative histogram is widening (the gap grew from about -0.6 to -1.7). [Bearish]
- Bollinger Bands (20): Upper $156.58, lower $126.02. Price is in the bottom 10% of the band, about $2.90 above the lower band, and the bands have narrowed from the September expansion. A walk down the lower band is possible, but a mean-reversion bounce is also plausible. [Neutral]
- CMF (20): -0.035, inside the ±0.05 neutral zone. It has recovered from the deep distribution readings (-0.31 on Oct 19) but cannot sustain positive territory (0.000 on Nov 4, then back negative). [Neutral]
- ADX (14): 16.0 and falling, so there is no strong trend and the market is range-like. −DI (26.7) is above +DI (20.1), and the bearish DI crossover came on Oct 30. Bears have a modest edge in a weak-trend environment. [Weak Trend, Bearish lean]
- Volume: 13.88M, moderate and not showing capitulation or a breakout surge. The recent selloff bars are red, but volume is well below the spikes seen at major turns (April, August-September). A break below support would need a volume pickup to confirm. [Neutral to mildly bearish]
DIVERGENCES & TRENDS
- No clear divergence: Price made a lower low ($128.93 vs. $130.51 on Oct 30) while RSI is about level (41.4 vs. 40.1). This is a mild, unconfirmed bullish hint and not a reversal signal.
- Moving averages: Price is below the EMA50, EMA200, SMA50D, SMA200D and VWAP ($140.48). Price has just lost the SMA200D ($133.74), which is now overhead resistance. The SMA50D ($144.43) has peaked (it was $144.60 on Nov 5) and is curling down. The gap to the SMA200D has narrowed to about $10.70, so a death cross is possible in the coming weeks if weakness persists.
- Trend: EMA50 < EMA200 and the long-term trend since the $250+ highs is down. The rally from the $95 base to about $168 in September was a bear-market rally that failed at the EMA200.
- Lower highs: The recent peaks ($168 in Sep, $153 on Oct 21) are lower highs, and momentum peaks on MACD and RSI have also been lower.
- Weak ADX: ADX below 20 means the stock has been ranging between roughly $126 and $153 for the past month or so.
CHART PATTERNS
- Descending triangle / bearish pennant (tentative): Lower highs from $168 to $153 to $146 sit against horizontal support near $126-$130. A decisive close below about $126 (the lower Bollinger Band) would confirm a breakdown. The measured move is the pattern height of about $27 ($153 minus $126), which projects to about $100. That also coincides with the prior consolidation base ($95-$105).
- Failed bear-market rally: The September advance stalled at the EMA200, which is classic resistance in a downtrend.
- Caveat: The pattern is still forming and ADX is weak, so the full measured move over 83 days is not the base case. The bearish pattern is only confirmed on a breakdown.
POTENTIAL SCENARIOS
- Scenario 1: Bearish Breakdown Toward the Base — Price loses the lower Bollinger Band and the $123-$126 support zone as MACD and −DI stay in control, then drifts toward the prior consolidation area. Trigger: daily close below $123.87 on rising volume. Target: $105-$112, with an extension toward $100. Invalidation: close back above $140 (the EMA50/VWAP area). (50% probability)
- Scenario 2: Bullish Mean-Reversion Recovery — Price holds the lower band, RSI turns up from the low 40s, and the stock reclaims the SMA200D and then the EMA50/VWAP cluster. Trigger: close above $134 and then $140. Target: $145-$152 (the SMA50D and then the EMA200). Invalidation: close below $123. (28% probability)
- Scenario 3: Neutral Range Chop — Price oscillates between $123 and $145 with low ADX and does not resolve. Trigger: failure to break either $123.87 or $145. Target: $125-$140. Invalidation: close outside the $120-$150 range. (22% probability)
PRICE TARGETS
Timeframe: 83 days, which falls in the 61-180 day bucket (18-30% range width).
- Target Price: $119.00
- Expected Range: $105.00 to $137.00 (width $32 = 24.8% of the current price, consistent with the 18-30% guidance)
- Key Levels: Support at $123.87, Resistance at $133.74
OVERALL BIAS
OVERALL BIAS: BEARISH - Price is below all key moving averages and VWAP, MACD has crossed bearishly with a widening negative histogram, −DI is above +DI, and lower highs against support near $126 form a descending-triangle structure. Weak ADX and a position near the lower Bollinger Band temper conviction, so the target is a moderate decline rather than the full measured move.
This is educational analysis and not financial advice.