NIO 83-day bearish forecast — Nov 8, 2026
- Bias: Bearish
- Timeframe: 83 days (made Nov 8, 2026, target date Jan 29, 2027)
- Price at analysis: $3.39
- Price target: $3.10
- Expected range: $2.70 – $3.65
- Result: Pending — graded after the close on Jan 29, 2027
Get a free AI analysis of NIO today
Analysis
TECHNICAL INDICATORS
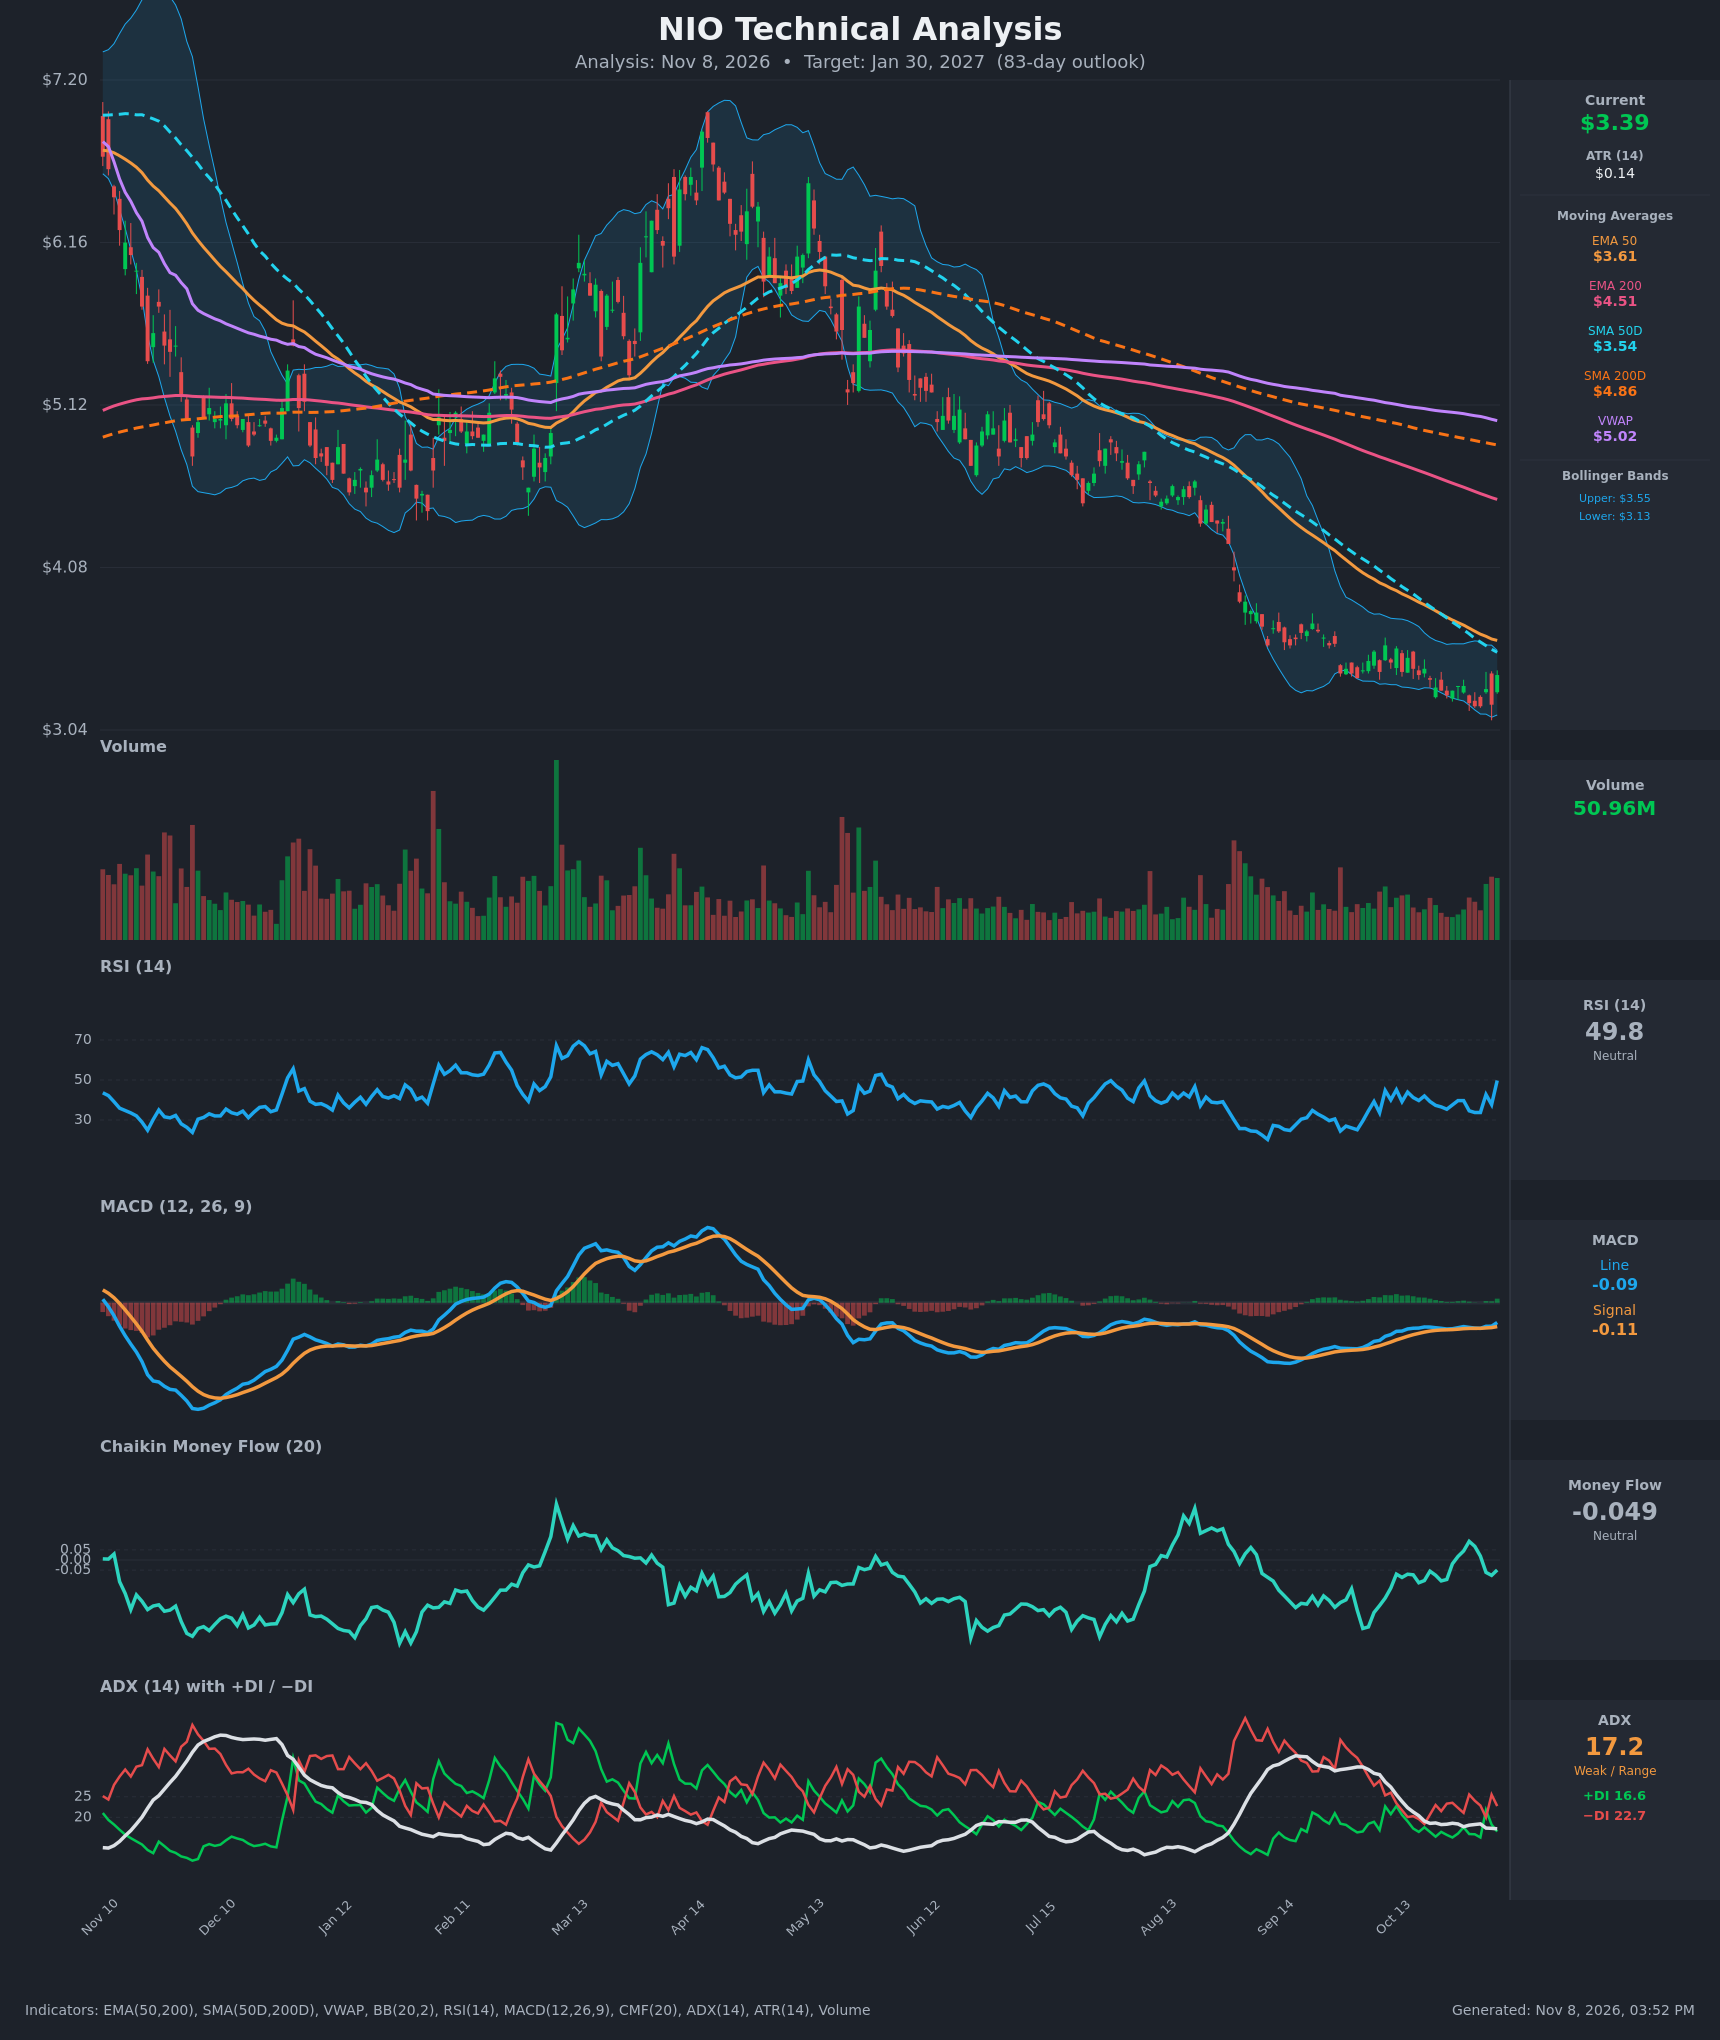
- RSI (14): 49.76, up sharply from 33.7 on Nov 3 and back to the neutral midline. Momentum is recovering, but this is only a relief bounce inside a longer downtrend. RSI failed to get above 50 for most of the past 6 months. [Neutral]
- 20 EMA: No 20 EMA value was supplied, so I use the EMA 50 of $3.61 and the SMA 50D of $3.54 as the nearest dynamic references. Price at $3.39 sits below both, and both are falling every bar. They are overhead resistance, with the EMA 50 about 6.5% above price. [Bearish]
- MACD: Line -0.090 vs signal -0.108, so the line has crossed above the signal and the histogram is positive (+0.018) and rising. This is an early bullish momentum turn, but both lines are still below zero, so it looks like a relief bounce rather than a trend change. [Bullish]
- Bollinger Bands (20): Upper $3.5477, lower $3.1343, mid about $3.34. Price is just above the midline after bouncing from the lower band. The bands are narrow, so volatility is contracting after the sharp August-September drop. Price has walked along the lower band for weeks, a sign of a downtrend, and a close back above the midline is the first sign of stabilization. [Neutral]
- CMF (20): -0.049, just inside the neutral zone after swinging between +0.09 and -0.11 in recent weeks. There is no sustained accumulation, and the latest slide back toward -0.05 shows buyers fading on the bounce. [Neutral]
- ADX (14): 17.2 with −DI at 22.7 above +DI at 16.6. The trend is weak and range-bound by the ADX reading, but bears still have directional control. ADX has been drifting down from the September peak, which fits a decelerating decline or a base. [Weak Trend - Bearish lean]
- Volume: 50.96M, with the latest green bar slightly above the recent average. There is no volume capitulation or breakout surge. The bounce has lacked conviction and is unconfirmed. [Neutral / mildly supportive of bounce]
DIVERGENCES & TRENDS
- Moving averages: The death cross is long established. SMA50D ($3.54) is far below SMA200D ($4.86), and EMA50 ($3.61) is far below EMA200 ($4.51). Price is below VWAP ($5.02), which is about 48% overhead. Every average is still declining, so the long-term trend is firmly bearish.
- Mild bullish divergence: The Nov 3 low at $3.19 matched the Oct 30 low, and RSI held in the low 30s instead of making new lows. MACD has also been making higher lows since September. This is a short-term stabilization signal, not a confirmed reversal.
- Crossover: MACD crossed above its signal on Nov 6, and RSI jumped from 37.7 to 49.8 in one bar. The +DI/−DI relationship has not flipped, and −DI is still on top.
- Resistance cluster: The EMA50 and SMA50D at $3.54-$3.61 sit right at the upper Bollinger Band at $3.55. This is the first major test for the bounce.
CHART PATTERNS
- Primary pattern: A long descending channel with lower highs and lower lows since the April peak near $7, including the sharp breakdown in August-September. Price is below every moving average, which is bearish continuation structure.
- Current structure: A tight base in the $3.19-$3.45 range. It could be read as a Bullish Triple Bottom / Double Bottom with support at $3.19-$3.20 and a neckline near $3.45-$3.55. A confirmed break above $3.55 would target about $3.90 (neckline plus pattern height).
- Competing read: The same base could be a Bearish Flag/Pennant-type pause after the steep August-September decline. A breakdown below $3.19 would project toward $2.80-$3.00.
- Verdict: The trend is down and the base has not yet been confirmed. With weak ADX, neither pattern is decisive, but the bearish continuation has slightly more weight because it matches the higher-timeframe trend.
POTENTIAL SCENARIOS
- Scenario 1: Bearish Trend Continuation — The bounce stalls at the $3.54-$3.61 moving-average cluster, −DI stays dominant, and price loses the $3.19 triple-bottom support, resuming the multi-month downtrend. Trigger: rejection at $3.55-$3.61 followed by a daily close below $3.19. Target: $2.80-$3.10. Invalidation: daily close above $3.65 with rising volume. (47% probability)
- Scenario 2: Bullish Base Breakout / Relief Rally — The MACD bullish cross and RSI recovery extend, and the triple-bottom neckline breaks. Price squeezes toward the falling EMA50 and the upper end of the broader range. Trigger: close above $3.61 on above-average volume with CMF above +0.05. Target: $3.90-$4.10. Invalidation: close below $3.19. (33% probability)
- Scenario 3: Neutral Range Consolidation — Weak ADX keeps price chopping between $3.15 and $3.60 for the full period. Trigger: repeated failures at $3.55 and holds at $3.19. Target: $3.30-$3.50. Invalidation: close outside the $3.15-$3.65 band. (20% probability)
PRICE TARGETS
- Target Price: $3.10 (83-day horizon)
- Expected Range: $2.70 to $3.65 (width $0.95, about 28% of the $3.39 current price, in line with the 61-180 day guidance of 18-30%)
- Key Levels: Support at $3.19, Resistance at $3.61
OVERALL BIAS
OVERALL BIAS: BEARISH - Price is below every major moving average and VWAP, the death cross is intact, and −DI leads +DI, while CMF shows no accumulation. The MACD cross and RSI rebound are early stabilization signs, but they have not changed the trend. A loss of $3.19 would likely drive a continuation lower.
This is educational analysis and not financial advice.