PFE 83-day bullish forecast — Nov 8, 2026
- Bias: Bullish
- Timeframe: 83 days (made Nov 8, 2026, target date Jan 29, 2027)
- Price at analysis: $29.39
- Price target: $30.40
- Expected range: $26.80 – $33.00
- Result: Pending — graded after the close on Jan 29, 2027
Get a free AI analysis of PFE today
Analysis
TECHNICAL INDICATORS
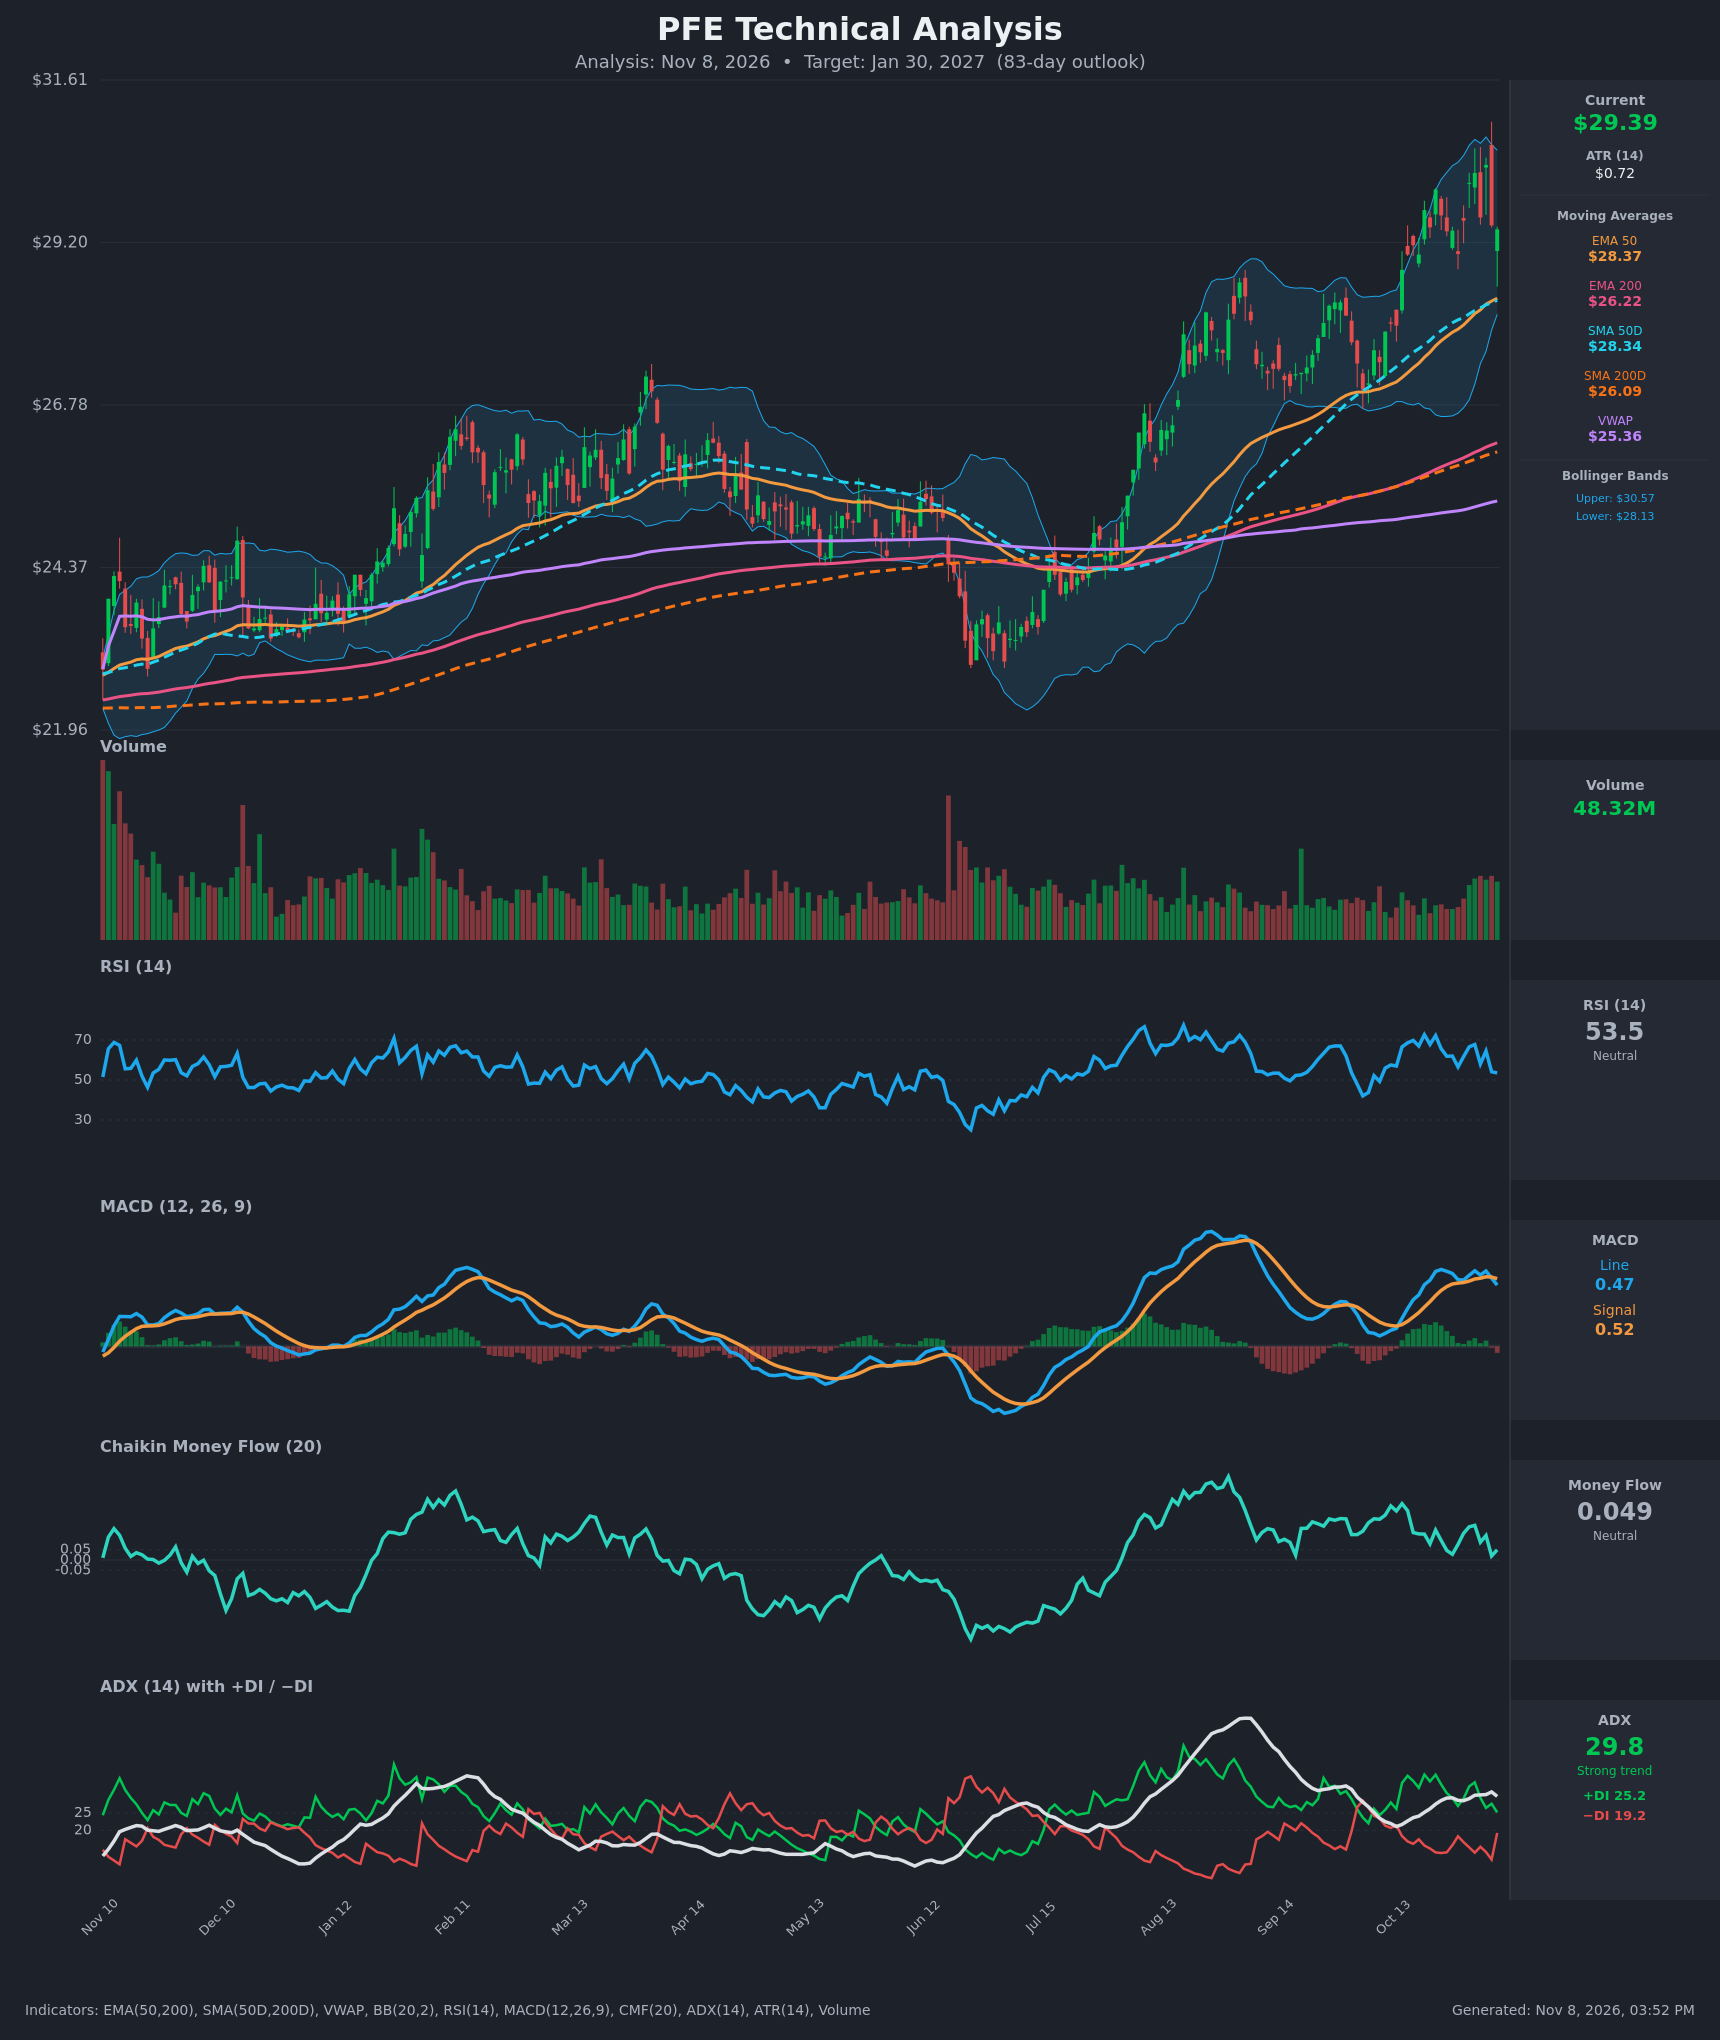
- RSI (14): 53.52, down from 72.7 on Oct 20 and 72.2 on Oct 22. It has lost its overbought momentum and sits just above the 50 midline. Momentum is cooling but not broken. [Neutral]
- 20 EMA: No 20 EMA value was supplied. The EMA 50 at $28.37 is the nearest dynamic support, about 3.5% below price, and the 20-period midline of the Bollinger Bands (roughly $29.35) is almost exactly at the current price. Price is holding above the EMA 50, with EMA 50 ($28.37) above EMA 200 ($26.22). [Bullish]
- MACD: Line 0.466 against signal 0.515, so the line has crossed below the signal (bearish crossover on Nov 5–6). The histogram is slightly negative and the line is falling from its 0.585 peak. Both lines are still above zero, so this is a pullback in momentum, not a trend reversal. [Bearish]
- Bollinger Bands (20): Upper $30.57, lower $28.13, price $29.39, mid-band. Price was rejected at the upper band (a $30.35 close on Nov 4 followed by a drop to $29.45). The bands are moderately wide, with no squeeze. Price is neutral within the bands after the upper-band rejection. [Neutral]
- CMF (20): 0.049, just under the +0.05 accumulation threshold. It was 0.16 on Oct 30–Nov 2 and has faded. Buying pressure has weakened to neutral. [Neutral]
- ADX (14): 29.8 with +DI 25.2 and −DI 19.2. ADX is above 25, so the trend is strong, and +DI is on top, so bulls still control. The DI spread has narrowed sharply from 36 vs 14, and −DI jumped from 11.6 to 19.2 in one bar. [Strong Trend + Bullish, weakening]
- Volume: 48.32M, slightly above the recent average. Volume has risen on the latest sell-off bars, which suggests some distribution near $30 but no capitulation. [Neutral to mildly cautious]
DIVERGENCES & TRENDS
- Long-term structure is bullish. Price is above SMA200D ($26.09), EMA 200 ($26.22) and VWAP ($25.36). SMA50D ($28.34) is above SMA200D, a golden cross that has been in place for months. The moving averages are all rising and fanned out.
- Mild bearish divergence in momentum. Price made higher highs ($29.98 → $30.08 → $30.23 → $30.35), but RSI peaked at 72.7 on Oct 20 and made lower highs, and the MACD line peaked at 0.585 on Oct 23. Momentum is lagging price.
- MACD has just crossed down through its signal line, a short-term bearish crossover.
- ADX has plateaued around 29–31 and +DI has fallen from 36 to 25. The advance is losing thrust but remains a trend.
- CMF is trending down from 0.167 to 0.049, a fading accumulation signal.
- Price is about 3.6% above the EMA 50 and SMA50D. The last time it stretched this far (August), it pulled back to the rising 50-day average and then resumed higher.
CHART PATTERNS
- Possible short-term Bearish Triple Top / Double Top (reference diagram): repeated rejections at $30.0–$30.35 with a neckline around $28.4–$29.0. A confirmed breakdown below about $28.1–$28.4 (lower Bollinger Band, EMA 50 and SMA50D) would imply a measured move to roughly $26.5–$27.
- Larger bullish context: the move from about $22.6 (June) to $30 looks like a Bullish Inverted Head and Shoulders or Double Bottom reversal from the June–July lows. After a strong run, the current $28.4–$30.4 band behaves like a bullish flag or consolidation. A breakout above $30.4 would project to about $32–$33, using the roughly $2 flag range added to the breakout.
- The pattern is not yet resolved. The bullish higher-timeframe structure outweighs the minor top, but a close below $28.1 would shift the evidence.
POTENTIAL SCENARIOS
- Scenario 1: Bullish Consolidation Then Breakout — Price pulls back to the rising EMA 50/SMA50D zone ($28.3–$28.4), the MACD resets, and the strong ADX trend resumes with +DI back above 30. Trigger: a daily close above $30.40 on rising volume with CMF back above +0.05. Target: $31.50–$33.00. Invalidation: a daily close below $28.10. (50% probability)
- Scenario 2: Bearish Failed Breakout and Deeper Retracement — The upper-band rejection, MACD crossover and fading CMF lead to a triple-top breakdown and a trend pause. Trigger: a close below $28.10 (lower band and 50-day averages) with a widening −DI. Target: $26.50–$27.00, near the prior breakout zone. Invalidation: a reclaim of $29.60 and then $30.40. (30% probability)
- Scenario 3: Neutral Range Chop — Price oscillates between $28.2 and $30.4 as ADX fades below 25. Trigger: continued overlap of candles and RSI hovering around 50. Target: $28.5–$30.0. Invalidation: a decisive close outside the $28.1–$30.4 range. (20% probability)
PRICE TARGETS
- Target Price: $30.40 (83 days, around Jan 30, 2027)
- Expected Range: $26.80 to $33.00 (width $6.20, about 21% of current price, consistent with the 61–180 day guidance of 18–30%)
- Key Levels: Support at $28.37 (EMA 50 / SMA50D, with the lower Bollinger Band at $28.13 just beneath), Resistance at $30.35 (recent swing high and upper Bollinger Band zone at about $30.57)
OVERALL BIAS
OVERALL BIAS: BULLISH - Price is above a fully bullish moving-average stack (golden cross, price above SMA200D), ADX is above 25 with +DI on top, and a pullback toward the $28.4 support is likely to be bought. Conviction is modest because of the fresh MACD bearish crossover, fading RSI and CMF, and the repeated rejection near $30.35, so a break below $28.1 would invalidate the call.
This is educational analysis and not financial advice.