SLV 83-day bearish forecast — Nov 8, 2026
- Bias: Bearish
- Timeframe: 83 days (made Nov 8, 2026, target date Jan 29, 2027)
- Price at analysis: $46.87
- Price target: $44.00
- Expected range: $37.00 – $52.00
- Result: Pending — graded after the close on Jan 29, 2027
Get a free AI analysis of SLV today
Analysis
TECHNICAL INDICATORS
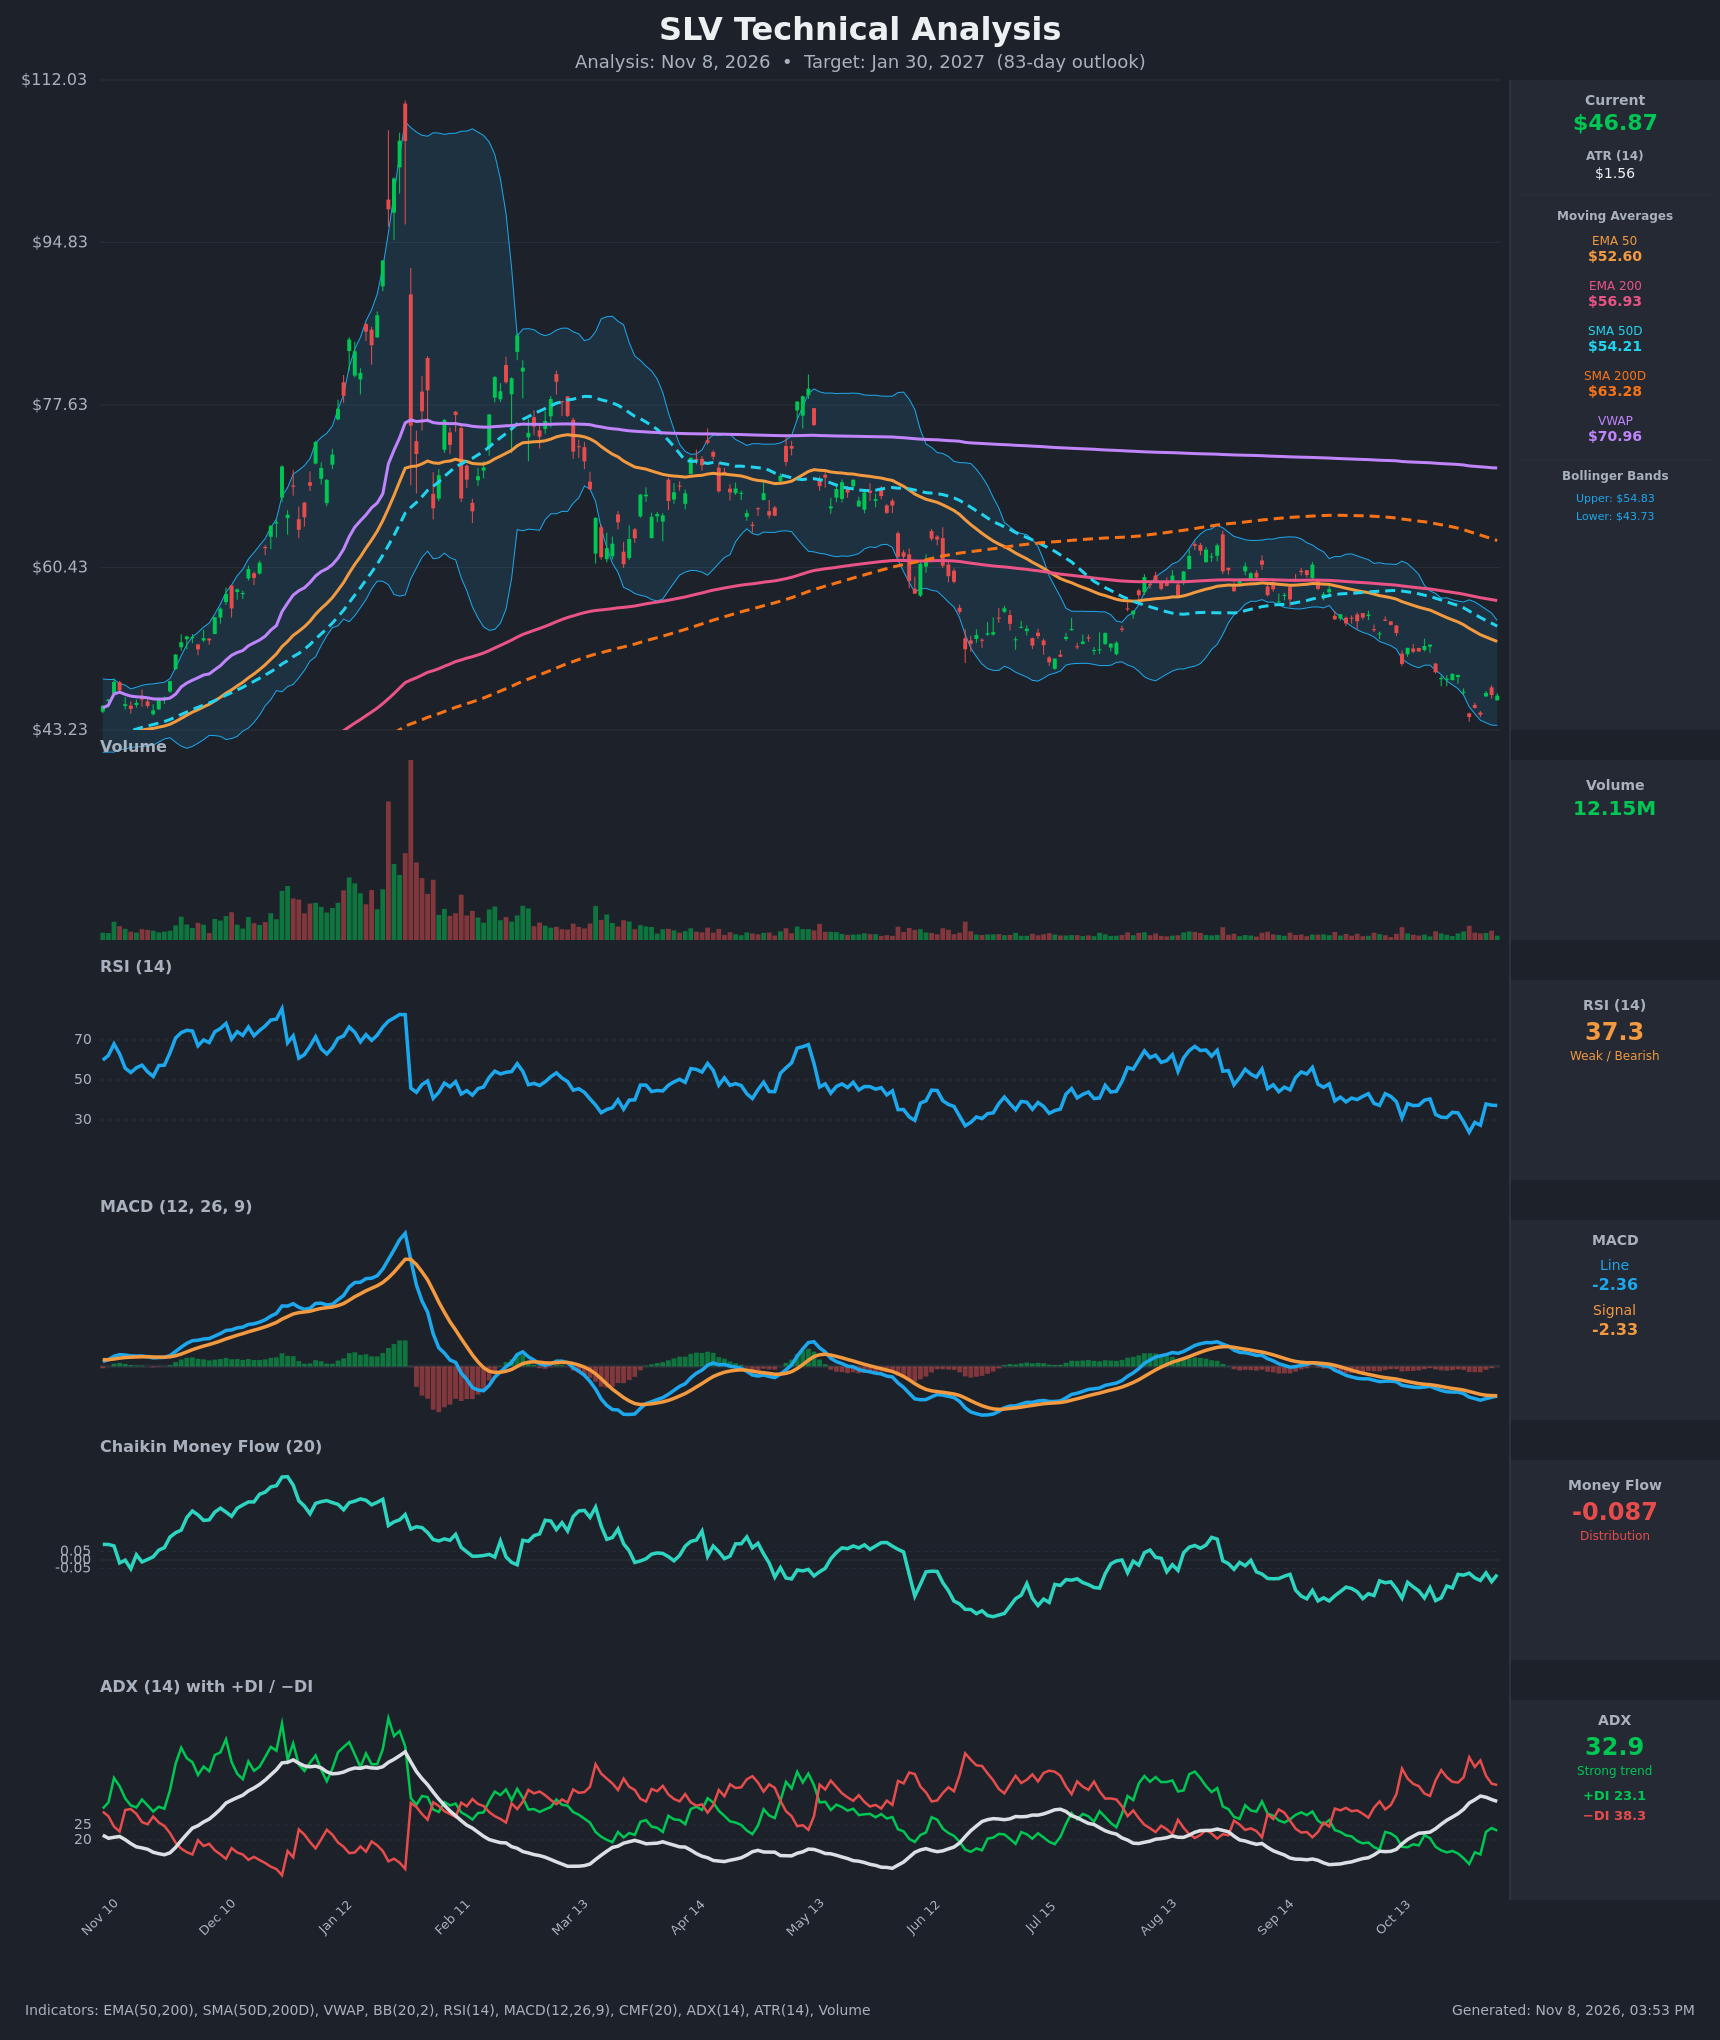
- RSI (14): 37.26, up from the 23.9 oversold low on Oct 30 but still below 50. It has bounced only modestly, and the chart shows repeated failures to hold above 40. Momentum is weak with a slight stabilization. [Bearish]
- 20 EMA: Not supplied. Substitute EMA 50 at $52.60 with price ($46.87) about 11% below it, and EMA 200 at $56.93 sits even higher. Both are falling and act as overhead resistance. [Bearish]
- MACD: Line -2.355 vs signal -2.334, a very small negative gap. The line was below the signal for most of the last 15 bars and is converging, so the histogram is just barely negative. Both lines are deeply below zero, so momentum is bearish but the downside thrust is fading. [Bearish]
- Bollinger Bands (20): Upper $54.83, lower $43.73, midline about $49.28. Price at $46.87 sits in the lower half, after touching or breaking the lower band around Oct 30 ($44.60). The bands are wide, so volatility is elevated. The bounce has not reclaimed the midline. [Bearish]
- CMF (20): -0.087, below the -0.05 threshold and negative for the whole 15-bar window, with a longer chart stretch spent below zero. This is persistent distribution, though it is improving from -0.24. [Distribution]
- ADX (14): 32.9, above 25 but easing from 34.6. −DI at 38.3 is well above +DI at 23.1, so bears dominate. This is a strong downtrend, slightly past peak intensity. [Strong Trend – Bearish]
- Volume: 12.15M, subdued relative to the huge volume at the January spike. Volume has been low and fairly steady through the decline, so there is no capitulation spike to mark a bottom. [Neutral / No capitulation]
DIVERGENCES & TRENDS
- Price vs. RSI: The Oct 30 low ($44.60) had RSI 23.9. The Nov 3 retest ($44.84) printed RSI 27.4, a higher RSI low on a nearly equal price low. This is a mild bullish divergence, but RSI has since stalled below 40.
- MACD: The line is converging with the signal, so a bullish crossover is possible in the next bar or two. With both lines far below zero, it would be a weak, counter-trend signal.
- MA structure: The death cross is already in place (SMA50D $54.21 vs SMA200D $63.28). EMA50 is below EMA200, and price is below all moving averages, with VWAP at $70.96 far above. This is a confirmed long-term downtrend after the parabolic blow-off near $110.
- ADX/DI: −DI has been above +DI almost continuously since October. The ADX rise from 22 to 34 confirms trend strength. +DI recovered from 12 to 23 but remains well short of −DI.
- CMF: Persistent negativity shows no accumulation. A series of lower highs in the price chart has accompanied it.
CHART PATTERNS
- Bearish trend structure: After the January peak near $110, SLV has made a long series of lower highs and lower lows. This resembles a large Head and Shoulders / broad topping reversal that completed once price broke the mid-year support area near $50-52.
- Possible Bullish Double Bottom: The Oct 30 low ($44.60) and Nov 3 low ($44.84) form a double-bottom attempt. Confirmation needs a break above the neckline near $48.5-$49 (the bounce high around $49.2), and more importantly the BB midline and EMA cluster. Even if confirmed, the measured move (about $4.4) points to roughly $53.5, which is where EMA50 and SMA50D resistance sits.
- Bearish Flag/Continuation: The base is small and shallow, which is more consistent with a pause within a downtrend than a durable reversal.
- Targets: A break below $44.60 opens a measured move toward the high $30s to low $40s. A confirmed double bottom caps near $53.5.
POTENTIAL SCENARIOS
- Scenario 1: Bearish Trend Continuation — The strong −DI dominance, distribution in CMF, and a stack of falling moving averages overhead favor another leg lower once the double-bottom attempt fails. Trigger: daily close below $44.60 on rising volume. Target: $40.00, with an extension to $37.50. Invalidation: daily close above $52.60 (EMA50). (50% probability)
- Scenario 2: Neutral Base-Building Range — The double bottom holds and price chops between $43.50 and $52 as ADX fades below 25 and RSI oscillates around 40-50. Trigger: failure to break either $44.60 or $49.30 for several weeks. Target: $46-$49 mid-range. Invalidation: close outside the $43.50-$52.50 range. (20% probability)
- Scenario 3: Bullish Double-Bottom Reversal — The bullish RSI divergence and MACD crossover lead to a relief rally that confirms the double bottom and reaches the moving average cluster. Trigger: close above $49.30, then above $52.60. Target: $53.50-$56.00. Invalidation: close below $44.60. (30% probability)
PRICE TARGETS
For the 83-day timeframe (61-180 day guidance: ~18-30% width):
- Target Price: $44.00
- Expected Range: $37.00 to $52.00 (width $15.00 = 32% of current price. This is slightly above the guidance band but reflects a volatile asset with ATR of $1.56 and strong trend potential.)
- Key Levels: Support at $44.60, Resistance at $49.30
Note: A tighter range of $38.00 to $51.50 (about 29%) is also consistent with these figures, but the wider range is retained for the elevated volatility.
OVERALL BIAS
OVERALL BIAS: BEARISH - A confirmed death cross, price below every moving average, −DI (38.3) far above +DI (23.1) with ADX at 32.9, MACD below zero, and CMF in distribution all point to a continuing downtrend. The mild RSI divergence and potential double bottom offer relief-rally risk, but they lack volume confirmation.
This is educational analysis and not financial advice.