QUBT 83-day bearish forecast — Nov 8, 2026
- Bias: Bearish
- Timeframe: 83 days (made Nov 8, 2026, target date Jan 29, 2027)
- Price at analysis: $6.33
- Price target: $5.55
- Expected range: $4.75 – $6.55
- Result: Pending — graded after the close on Jan 29, 2027
Get a free AI analysis of QUBT today
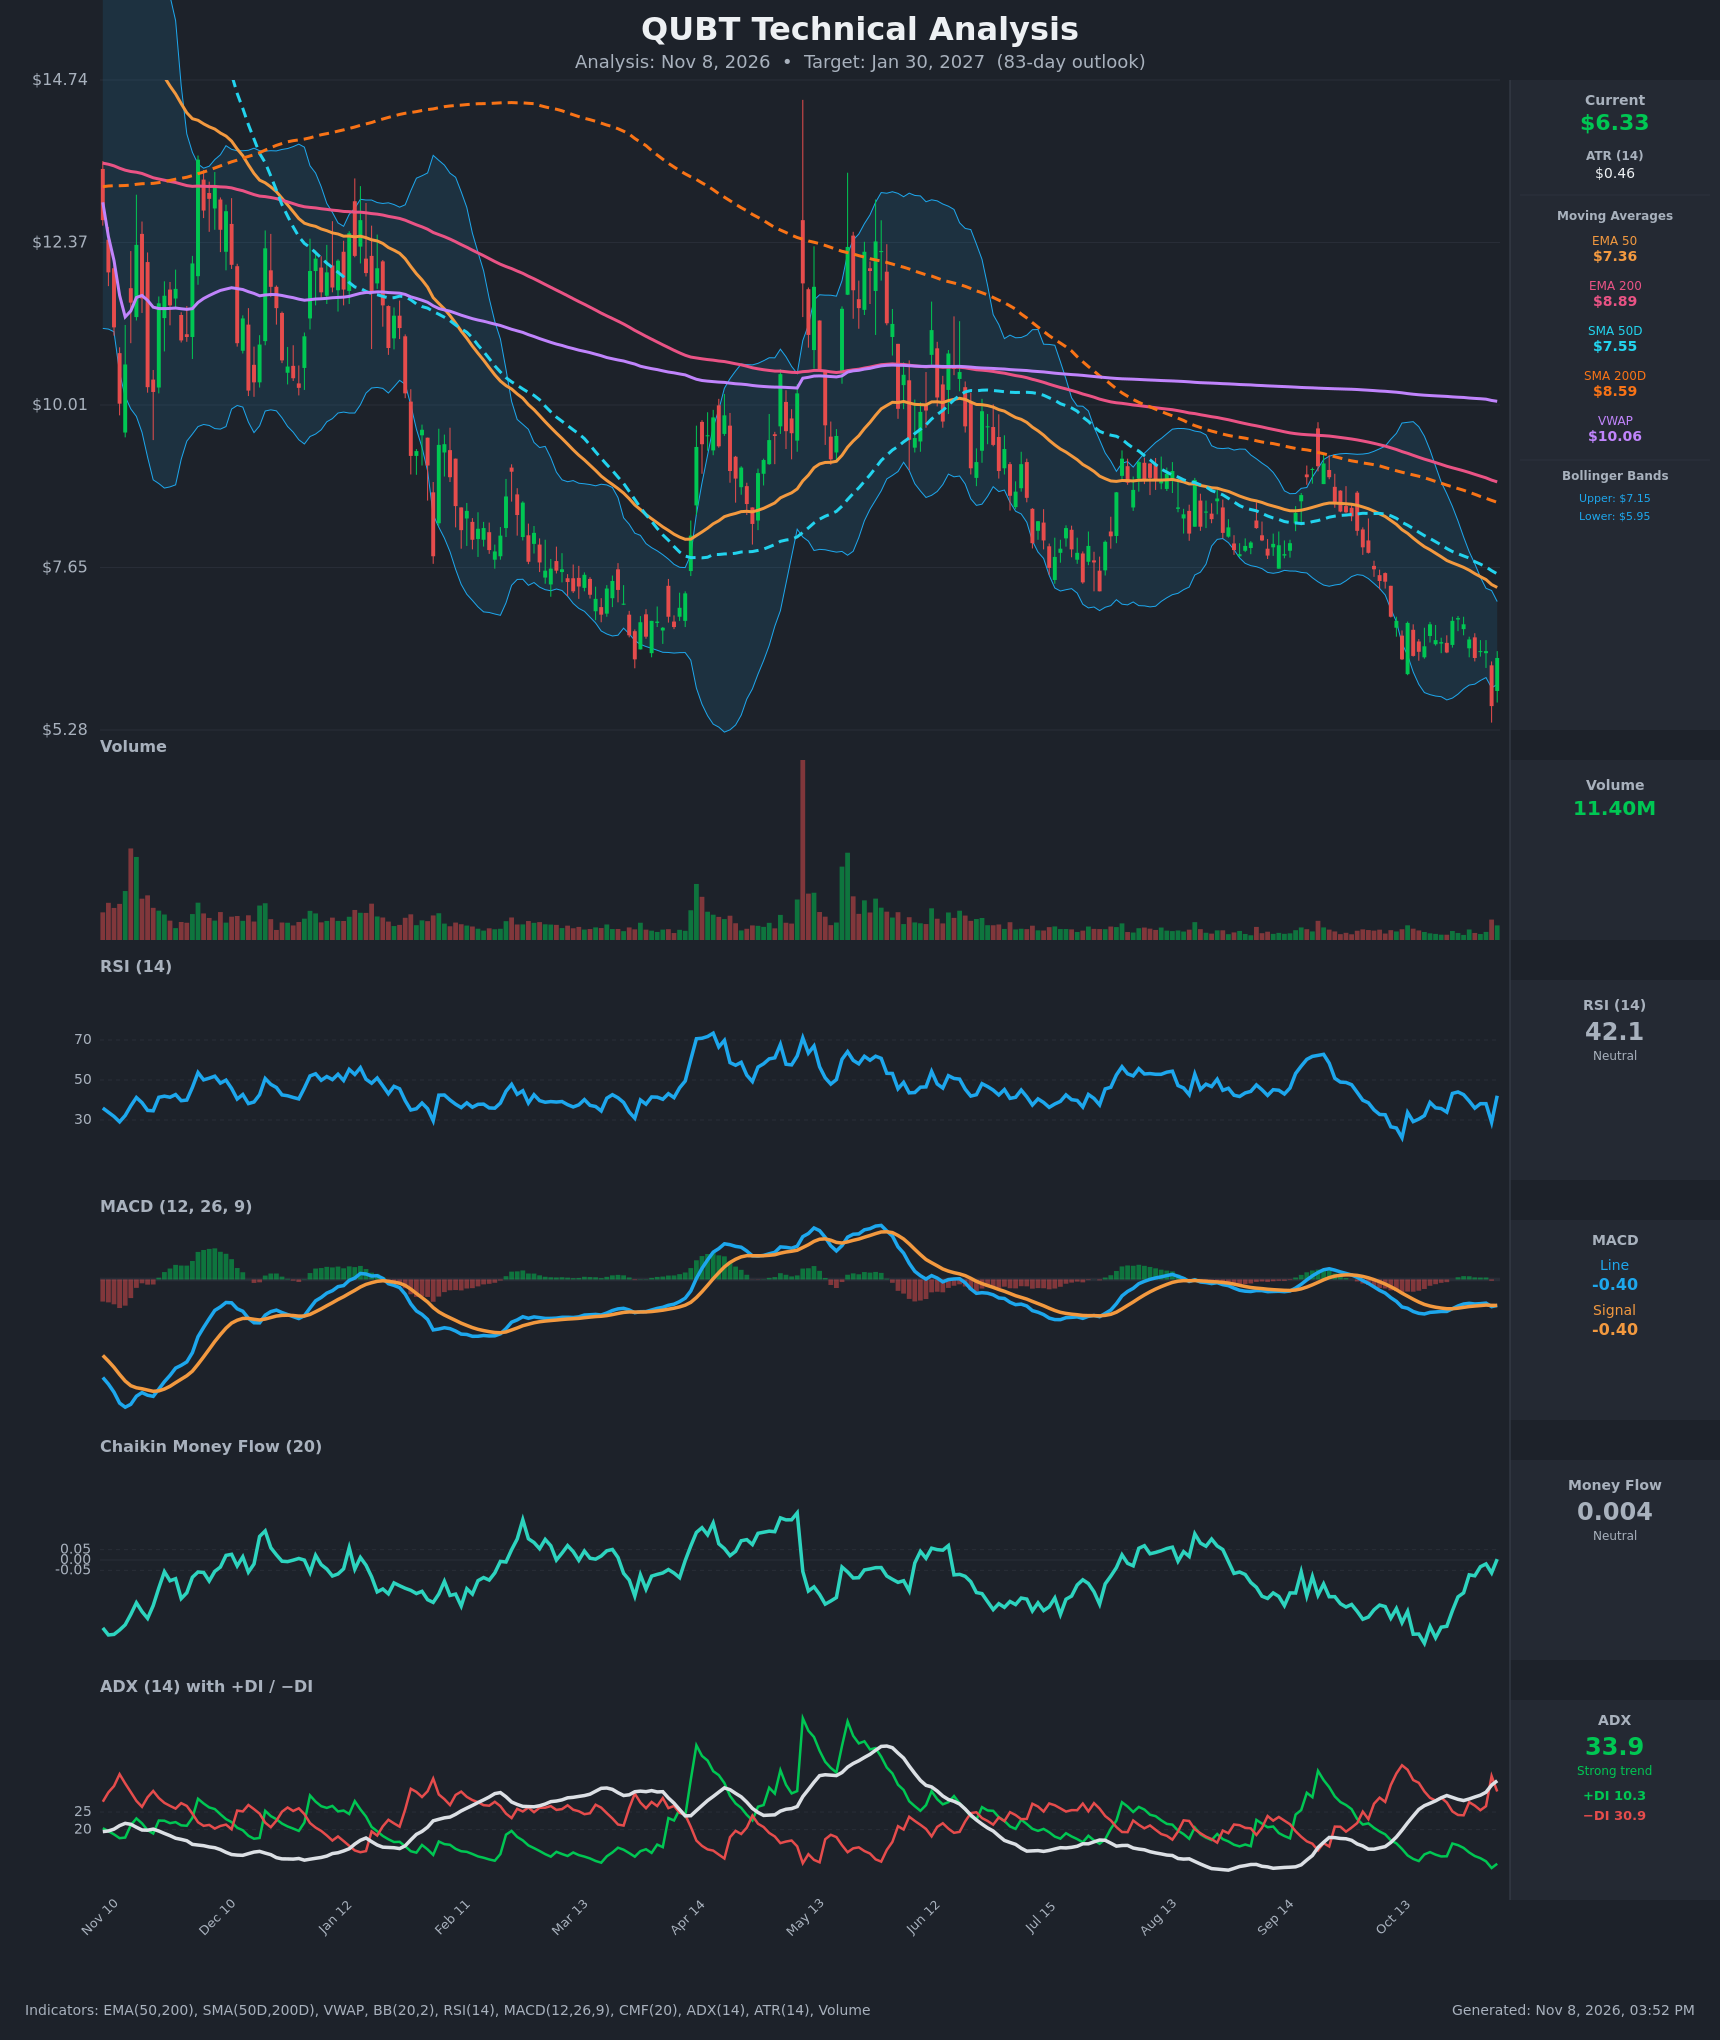
Analysis
TECHNICAL INDICATORS
- RSI (14): 42.13, up from 28.9 on Nov 5 (oversold). It is still under 50 and has made lower highs since the summer (peak 44 on Oct 28). The bounce is a relief move in a weak-momentum regime, not a confirmed turn. [Bearish]
- 20 EMA: Not supplied, so I use the Bollinger 20-period midline (~$6.55) as a proxy. Price at $6.33 is below it, and the midline is sloping down. Price is also far below EMA50 ($7.36) and SMA50D ($7.55), which act as stacked overhead resistance. [Bearish]
- MACD: Line -0.3957 vs. signal -0.3953, essentially flat and on the verge of a crossover. The histogram is near zero after being slightly negative. Both lines are below zero, so this is fading downside momentum, not a bullish signal. [Neutral]
- Bollinger Bands (20): Upper $7.15, lower $5.95, midline ~$6.55. Price spiked below the lower band on Nov 5 ($5.63 close) and snapped back inside. The bands are fairly tight after a steep decline, and price is in the lower half. Rallies toward the midline or upper band are likely to meet selling. [Bearish]
- CMF (20): +0.004, neutral (between ±0.05). It has recovered from about -0.40 in October, so heavy distribution has eased, but there is no real accumulation yet. [Neutral]
- ADX (14): 33.9 and rising (from 25.7 on Oct 19). −DI at 30.9 is far above +DI at 10.3, so bears control a strong trend. The Nov 5 flush spiked −DI to 35.3. [Strong Trend – Bearish]
- Volume: 11.40M, above the very thin readings of recent weeks. Volume expanded on the Nov 5 breakdown and again on the rebound, which hints at some capitulation. Without sustained follow-through, though, it does not confirm a reversal. [Neutral to slightly Bearish]
DIVERGENCES & TRENDS
- Death cross in force: SMA50D ($7.55) is below SMA200D ($8.59), and EMA50 ($7.36) is below EMA200 ($8.89). The gaps are still wide and not closing in a bullish direction.
- Price below all key averages: Price sits below SMA200D, EMA200 and VWAP ($10.06), a clear long-term downtrend. The 200-period averages are rolling over, and VWAP is far overhead.
- Mild bullish divergence on the very short term: The Nov 5 low ($5.63) came with RSI of 28.9, but the recovery to $6.33 is only a bounce within the downtrend. RSI is still making lower highs on the larger swing.
- MACD convergence: The MACD line has been rising toward the signal line since Oct 20, so downside momentum is fading. A bullish cross would only matter if price clears about $6.90.
- ADX/DI: −DI has stayed above +DI throughout the 15-bar window with no DI crossover. ADX is rising, so the trend is strengthening, not exhausting.
- Sequence of lower highs and lower lows has continued since the spring spike toward $14.
CHART PATTERNS
- Bearish Flag / Rectangle continuation (most likely): After the sharp mid-October decline, price consolidated in a tight $6.3–$6.9 band with a slight upward drift. This matches the Bearish Flag Pattern in the reference. A break below ~$6.30 and the Nov 5 low ($5.63) projects a measured move of roughly $1.00–$1.30, toward $4.90–$5.30.
- Larger descending channel: Lower highs since the spring peak and a stepped decline resemble a broad Descending Triangle or channel structure. It is a bearish continuation structure while price stays below the declining moving averages.
- Possible Bullish Double Bottom (low probability): The $5.63 flush and the retest area could form a base. It needs a close above ~$6.90 (the neckline) to activate, with a target near $7.50.
POTENTIAL SCENARIOS
- Scenario 1: Bearish Trend Continuation — Bears keep control (ADX 33.9, −DI 30.9 vs. +DI 10.3), the bounce stalls under the Bollinger midline, and price breaks the flag/range to the downside, retesting the Nov 5 low and extending lower. Trigger: Daily close below $6.00 and then below $5.63. Target: $5.00–$5.55. Invalidation: Daily close above $7.15 (upper BB) with rising volume. (55% probability)
- Scenario 2: Bullish Relief Rally — The oversold bounce extends as the MACD crosses up and CMF turns positive, squeezing price toward the declining EMA50/SMA50D cluster. Trigger: Close above $6.90 with expanding volume and a MACD bull cross. Target: $7.35–$7.55 (EMA50/SMA50D). Invalidation: Failure at $7.15 and a close back below $6.30. (30% probability)
- Scenario 3: Neutral Base-Building Range — Selling exhausts and price chops between $5.63 and $6.90 while the moving averages catch down. Trigger: Repeated holds of $5.63 on declining volume. Target: $6.00–$6.60. Invalidation: Close outside the $5.63–$6.90 band. (15% probability)
PRICE TARGETS
- Target Price: $5.55 (83-day horizon, Jan 30, 2027)
- Expected Range: $4.75 to $6.55 (width $1.80, about 28% of the $6.33 current price, consistent with the 61–180 day guidance)
- Key Levels: Support at $5.63 (Nov 5 closing low), Resistance at $6.90 (late-October highs; above that, $7.15 upper BB and $7.36 EMA50)
OVERALL BIAS
OVERALL BIAS: BEARISH - Price is below every major moving average with a death cross in place, and ADX of 33.9 with −DI (30.9) far above +DI (10.3) shows a strong downtrend. The RSI/MACD bounce is a relief rally, not a confirmed reversal, and a break of $5.63 would likely extend the decline.
This is educational analysis and not financial advice.