EEM 97-day bearish forecast — Nov 8, 2026
- Bias: Bearish
- Timeframe: 97 days (made Nov 8, 2026, target date Feb 12, 2027)
- Price at analysis: $59.33
- Price target: $57.30
- Expected range: $52.00 – $65.00
- Result: Pending — graded after the close on Feb 12, 2027
Get a free AI analysis of EEM today
Analysis
TECHNICAL INDICATORS
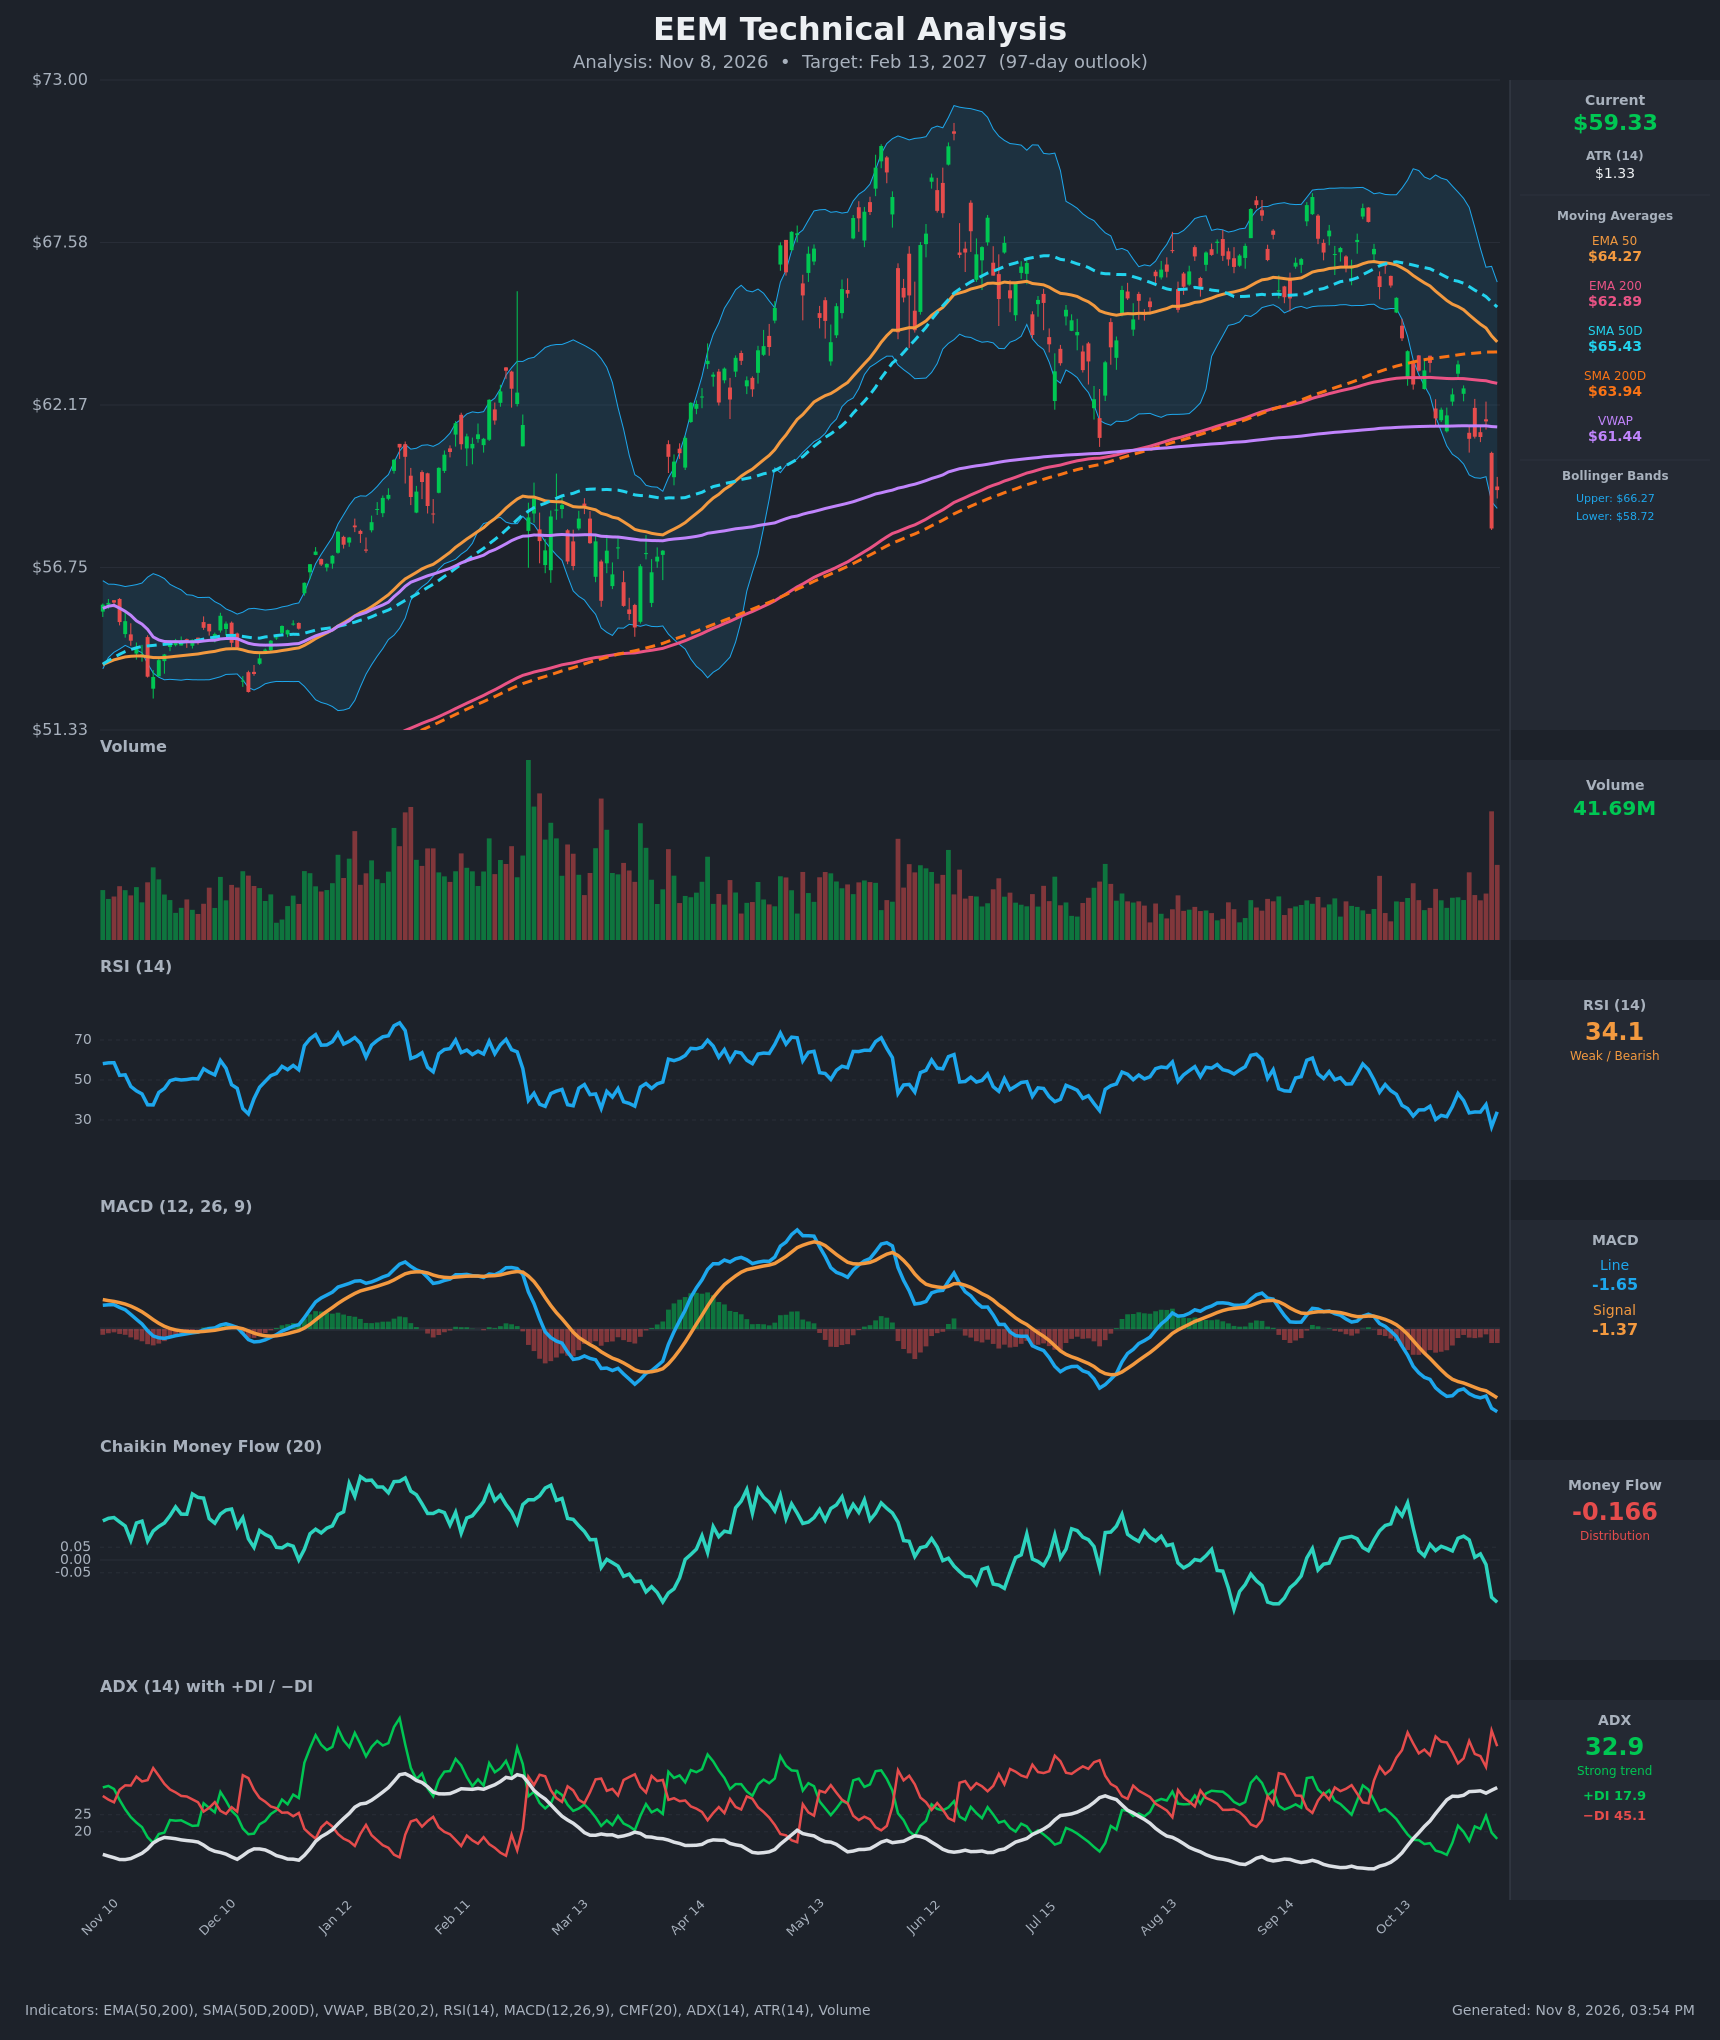
- RSI (14): 34.10, after a plunge to 26.6 on Nov 5 and a bounce. It has been stuck in the 26-37 zone for about three weeks, which is bearish-regime behavior, and the bounce is weak. Oversold readings in a strong downtrend often fail to produce a sustained rally. [Bearish]
- 20 EMA: Not provided. The EMA 50 ($64.27) and SMA 50 ($65.43) are both well above price and falling, so they act as overhead resistance. Price is about 7.7% below the EMA 50. [Bearish]
- MACD: Line -1.646 is below the signal line at -1.368, with the histogram negative and widening (about -0.28). The line is making new lows and has no bullish crossover. Momentum is accelerating down. [Bearish]
- Bollinger Bands (20): Upper $66.27, lower $58.72. Price ($59.33) sits just above the lower band after closing below it on Nov 5 ($58.05). Bands are expanding and sloping down, so this looks like a trend "walk" rather than a squeeze. A bounce toward the $62-63 midline is possible, but the trend bias is down. [Bearish]
- CMF (20): -0.166, well below -0.05. It fell from slightly positive on Oct 29 to its lowest in months, showing heavy distribution. [Distribution]
- ADX (14): 32.9 and rising, with −DI (45.1) far above +DI (17.9). This is a strong, established downtrend with bears firmly in control and no DI crossover in sight. [Strong Trend – Bearish]
- Volume: 41.69M, the largest spike on the chart, on the Nov 5 gap-down candle. This confirms the breakdown. It could mark a selling climax, but with CMF falling and no reversal candle it reads as distribution. [Bearish – high-volume breakdown]
DIVERGENCES & TRENDS
- There is no bullish divergence. RSI made a lower low (26.6) alongside price, MACD is at its lowest level on the chart, and CMF is making new lows. All three confirm the price decline.
- Price has lost every key level: the EMA 50, SMA 50, EMA 200 ($62.89), SMA 200 ($63.94), and VWAP ($61.44). Closing below the 200-day averages signals a shift to a long-term downtrend.
- The EMA 50 ($64.27) is converging with the EMA 200 ($62.89), and the SMA 50 ($65.43) is converging with the SMA 200 ($63.94). A bearish death-cross-style crossover is likely within weeks if weakness persists.
- ADX rose from 19.7 to 32.9 in under three weeks while −DI stays above 40, so trend strength is building on the downside.
- The Nov 5 candle closed at $58.05 with RSI at 26.6. Price recovered to $59.33 but did not reclaim the $61-62 gap zone, so it is a weak bounce.
CHART PATTERNS
- Bearish Double Top / lower-high structure: Highs near $72 (Jun) and about $69.5 (Sep) form a failed retest. Price has now broken the neckline near $61.5 (the July swing low and VWAP area). The measured move is the pattern height (about $8.50) subtracted from the neckline, which points to roughly $53.
- Bearish breakdown from a range: Price had ranged between about $61.5 and $69.5 for four months and has now broken out of it to the downside. This is a continuation of the drop that began from the $67 zone in October.
- Price has been dropping in a staircase of lower highs and lower lows since early October, and the Nov 5 gap-down is the breakdown leg.
- The measured target of about $53 is a full extension. In practice, support is likely around $56.75 and then the $52-54 area.
POTENTIAL SCENARIOS
- Scenario 1: Bearish Trend Continuation / Double Top Measured Move — The breakdown below the $61.5 neckline and the 200-day averages extends. Rallies stall at the VWAP and EMA 200, and price grinds toward the prior consolidation base. Trigger: failure to reclaim $61.5-62.9 and a close below $58.05. Target: $56.75, then $53-54. Invalidation: weekly close above $63.94 (SMA 200). (50% probability)
- Scenario 2: Bullish Oversold Rebound / Mean Reversion — The climactic selling volume and the oversold RSI spark a relief rally back toward the declining moving averages. Trigger: a close above $61.5 with MACD histogram flattening and CMF turning back above 0. Target: $62.90-$64.30 (EMA 200 / EMA 50). Invalidation: a close below $57.50. (30% probability)
- Scenario 3: Neutral Basing Range — Price stabilizes after the shock and chops sideways between about $56 and $62 as the averages catch down. Trigger: ADX turning down from the 30s with RSI holding 35-50. Target: around $59-60. Invalidation: a break of either $56 or $62.9. (20% probability)
PRICE TARGETS
- Target Price: $57.30 (97 days, roughly Feb 13, 2027)
- Expected Range: $52.00 to $65.00 (width $13.00, or about 21.9% of the current price, consistent with the 61-180 day guidance)
- Key Levels: Support at $56.75, Resistance at $61.44 (VWAP; then $62.89 EMA 200 and $63.94 SMA 200)
OVERALL BIAS
OVERALL BIAS: BEARISH - Price has broken below all major moving averages and VWAP on a high-volume gap-down, with ADX at 32.9 and −DI dominant, MACD making new lows, and CMF showing heavy distribution. The oversold RSI raises the odds of a bounce, but the structure points to a drift toward the $56-57 area and possibly lower over 97 days.
This is educational analysis and not financial advice.