GLD 97-day bullish forecast — Nov 8, 2026
- Bias: Bullish
- Timeframe: 97 days (made Nov 8, 2026, target date Feb 12, 2027)
- Price at analysis: $372.52
- Price target: $387.00
- Expected range: $342.00 – $418.00
- Result: Pending — graded after the close on Feb 12, 2027
Get a free AI analysis of GLD today
Analysis
TECHNICAL INDICATORS
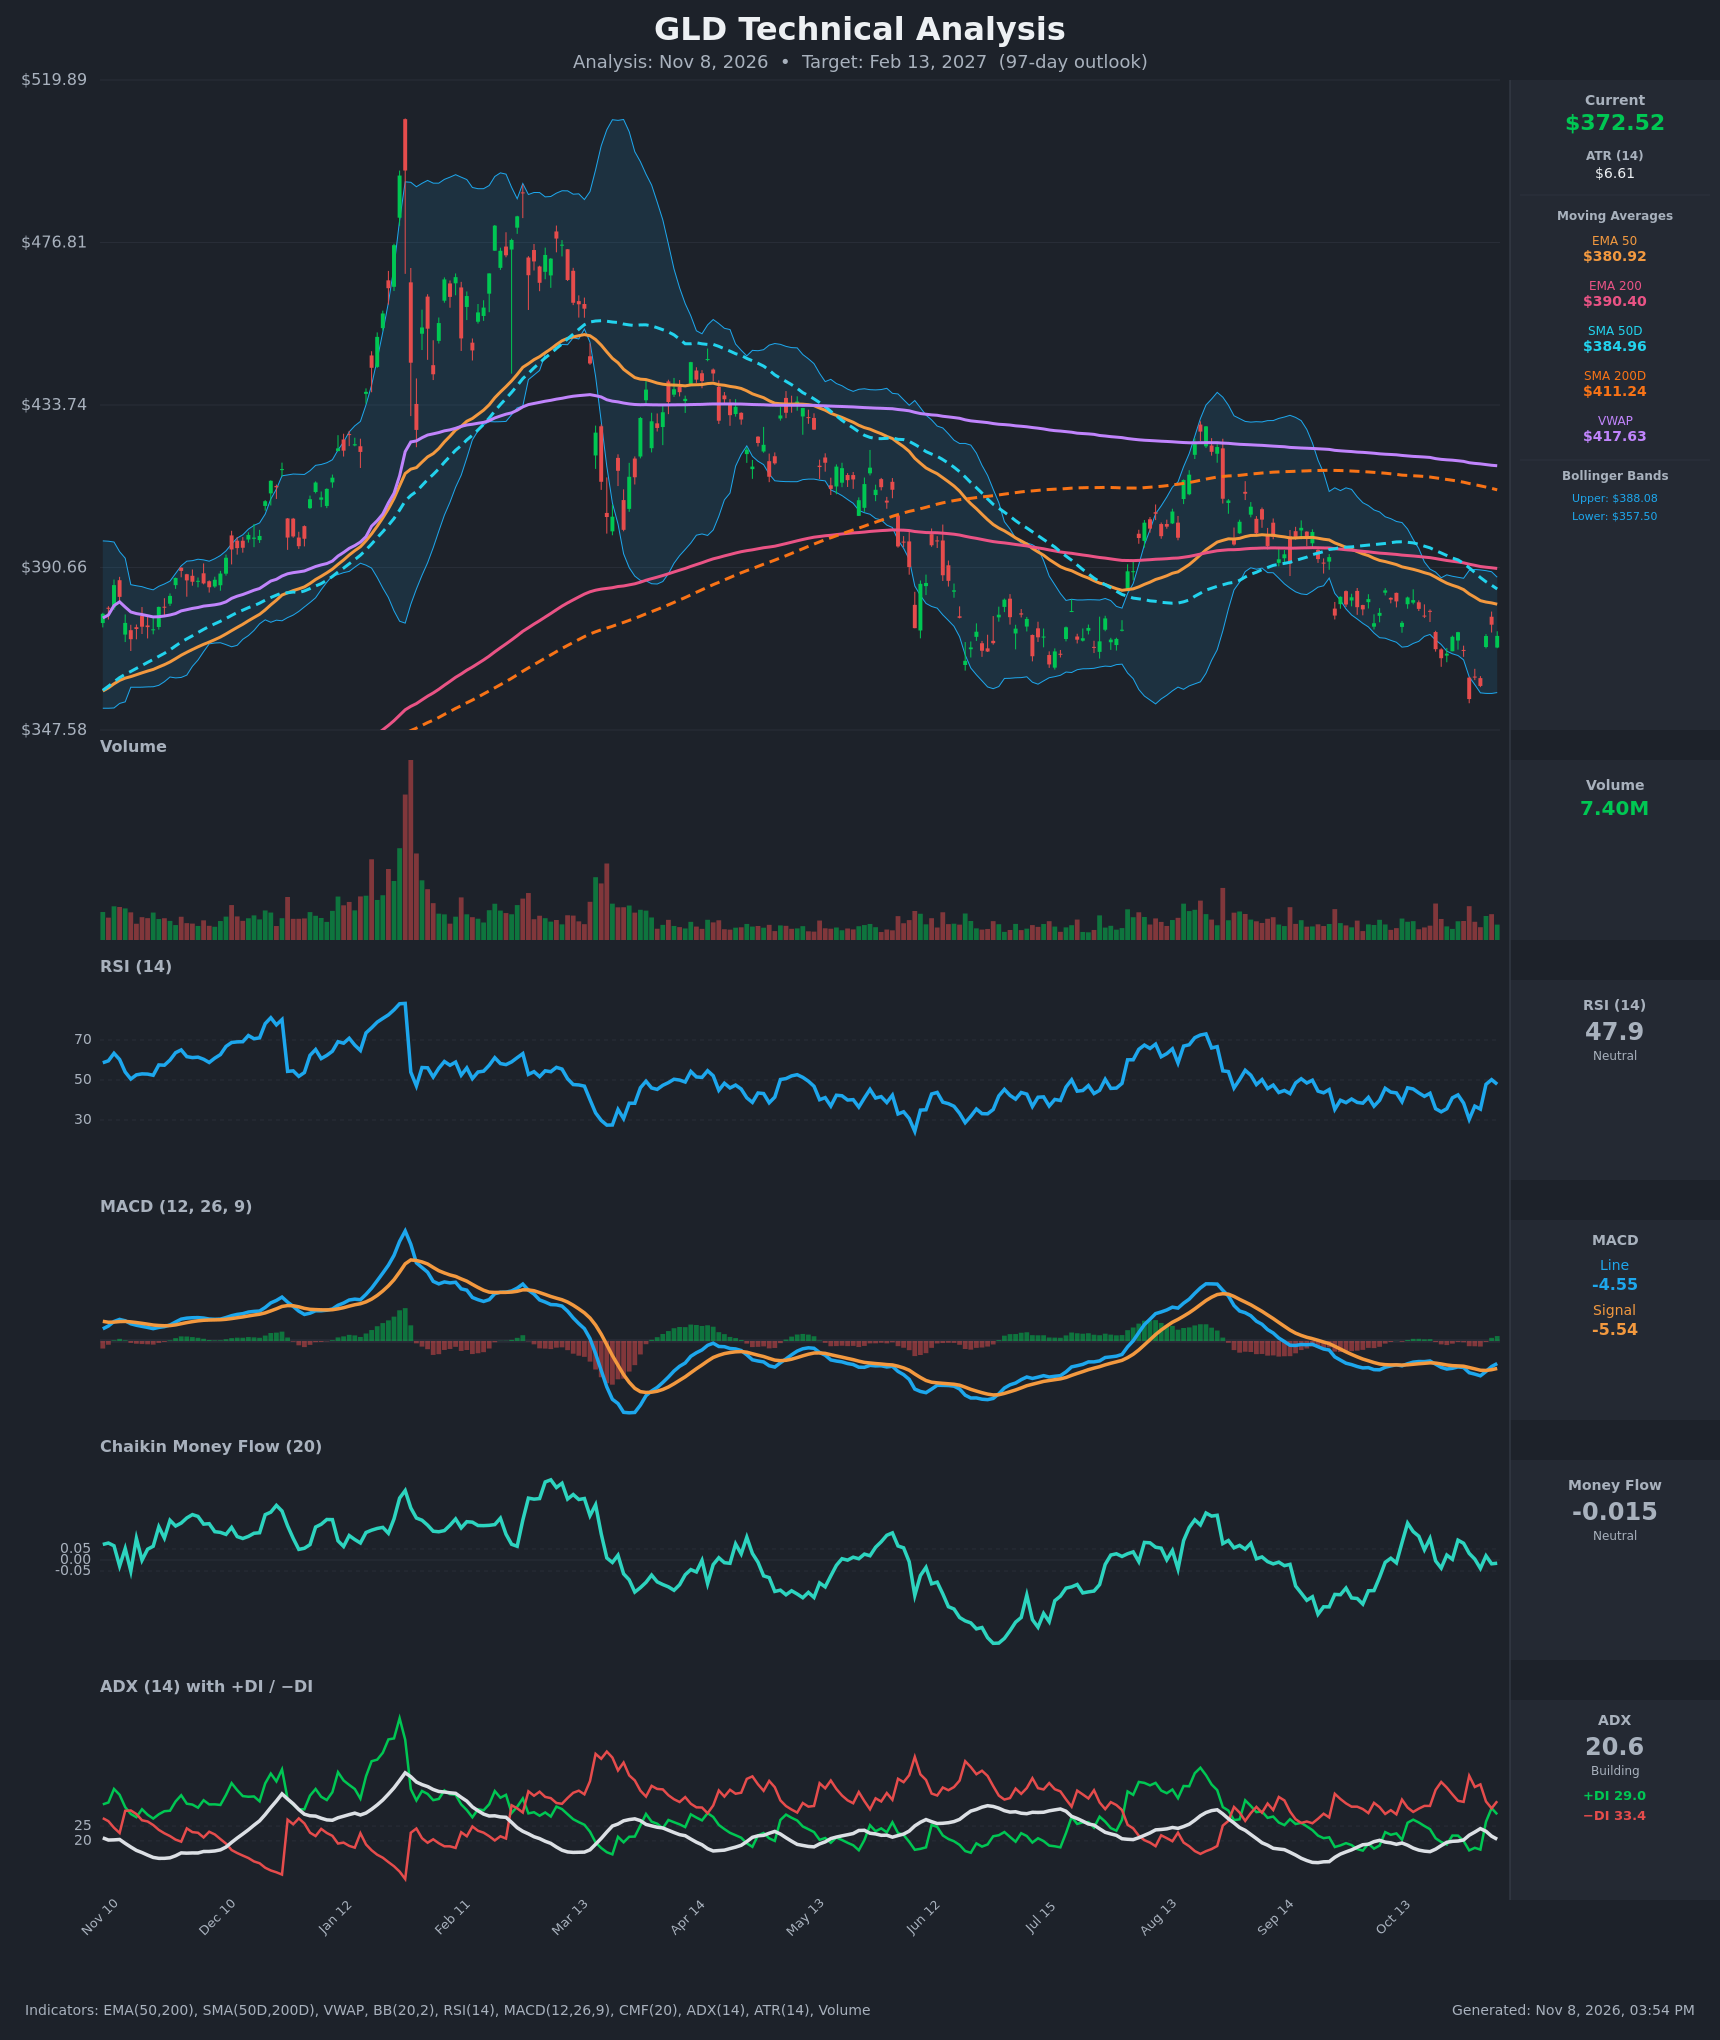
- RSI (14): 47.9, recovered from 30.3 on Oct 30 and a 35 area low on Nov 3. It is back near the 50 midline with momentum turning up, but it has not yet cleared 50 convincingly. [Neutral]
- 20 EMA: The 20 EMA is not provided. The EMA 50 is $380.92 and is falling, with price 2.2% below it. The EMA 50 also sits below the EMA 200 ($390.40), so the medium-term moving-average structure is bearish. Price is below the EMA 50, which acts as resistance. [Bearish]
- MACD: The line is -4.55 and the signal is -5.54. The line crossed above the signal around Nov 4-5 and the histogram has turned positive. Both lines remain well below zero, so this is a bounce within a downtrend rather than a trend reversal. [Bullish]
- Bollinger Bands (20): Upper is $388.08, lower is $357.50, and the midline is about $372.8. Price sits at the midline after bouncing off the lower band ($355.78 close on Oct 30). The bands are still wide, and the lower band has held. [Neutral]
- CMF (20): -0.015, inside the neutral ±0.05 band. It has hovered around zero for weeks, with no sustained accumulation or distribution. [Neutral]
- ADX (14): 20.6 and turning down from 24.1. −DI (33.4) is above +DI (29.0), so bears hold a slight edge, but +DI jumped from 17 to 31 over the last week and the gap is narrowing. Trend strength is marginal. [Weak Trend, bearish lean]
- Volume: 7.40M, an average-to-light reading. Volume is far below the January spike and the March and May selling bursts, so there is no capitulation or strong conviction either way. The recent bounce came on moderate volume. [Neutral]
DIVERGENCES & TRENDS
- Price made a marginally lower low in late October (about $355 and below), while RSI held above the 30 level and above its June low area. This is a mild bullish divergence.
- Price has formed a long series of lower highs (about $519, then $433, then roughly $400, then roughly $385). This is a clear intermediate downtrend.
- The SMA 50 ($384.96) is already below the SMA 200 ($411.24), so the death cross is in place. The EMA 50 is also below the EMA 200. Price is below the SMA 200 and VWAP ($417.63), which confirms a long-term downtrend.
- MACD bullish signal-line crossover on Nov 4-5, but below zero.
- A +DI/−DI crossover is a risk in either direction: +DI is rapidly closing in on −DI.
- The sharp Nov 4 bounce (+3.7%) pulled RSI from 35 to 48 and halted the slide, but price still has not reclaimed the EMA 50.
CHART PATTERNS
- Bullish Double/Triple Bottom (reversal): Lows near $352-$357 have held in June and again in late October, with a bounce each time. A close above the neckline near $385-$390 (the SMA 50 and EMA 200 area) would confirm it, with a measured target of about $415-$420.
- Bearish Descending channel / lower-highs structure: The trend since the peak remains down, and a clean break below $355 would invalidate the double-bottom. The measured target would be about $330-$335.
- The pattern read is mixed. The multi-month range between about $355 and $410 favors a bounce toward the moving-average cluster, but the overhead resistance stack is dense.
POTENTIAL SCENARIOS
- Scenario 1: Bullish Double-Bottom Recovery — The $355 support holds and price mean-reverts toward the moving-average cluster as the MACD cross and RSI recovery follow through. Trigger: daily close above $381 (the EMA 50), then above $385 (the SMA 50). Target: $385-$395, with an extension to $405 if $390 breaks. Invalidation: daily close below $355. (45% probability)
- Scenario 2: Bearish Breakdown Continuation — The bounce fails at the EMA 50/SMA 50 resistance, and the lower-highs, below-all-MAs structure resumes with a break of the $355 floor. Trigger: rejection at $381-$385 followed by a close below $355. Target: $335-$340. Invalidation: close above $390. (35% probability)
- Scenario 3: Neutral Range Chop — Price stays pinned between $355 and $385 as ADX stays near 20 and CMF hovers near zero. Trigger: failure to break either boundary. Target: $365-$378. Invalidation: close outside the $355-$390 range. (20% probability)
PRICE TARGETS
- Target Price: $387.00 (97-day horizon, roughly 3.9% above current price)
- Expected Range: $342.00 to $418.00 (width $76 = about 20.4% of current price, consistent with the 61-180 day guidance)
- Key Levels: Support at $355.78, Resistance at $384.96
OVERALL BIAS
OVERALL BIAS: BULLISH - Support near $355 has held repeatedly, RSI has recovered from oversold, and MACD has crossed up with a mild bullish divergence. Mean reversion toward the $385-$390 moving-average cluster over 97 days is slightly more likely than a breakdown. Conviction is modest because price is still below every major moving average, the death cross is in place, and −DI leads.
This is educational analysis and not financial advice.