IREN 97-day bearish forecast — Nov 8, 2026
- Bias: Bearish
- Timeframe: 97 days (made Nov 8, 2026, target date Feb 12, 2027)
- Price at analysis: $21.64
- Price target: $19.50
- Expected range: $14.50 – $27.50
- Result: Pending — graded after the close on Feb 12, 2027
Get a free AI analysis of IREN today
Analysis
TECHNICAL INDICATORS
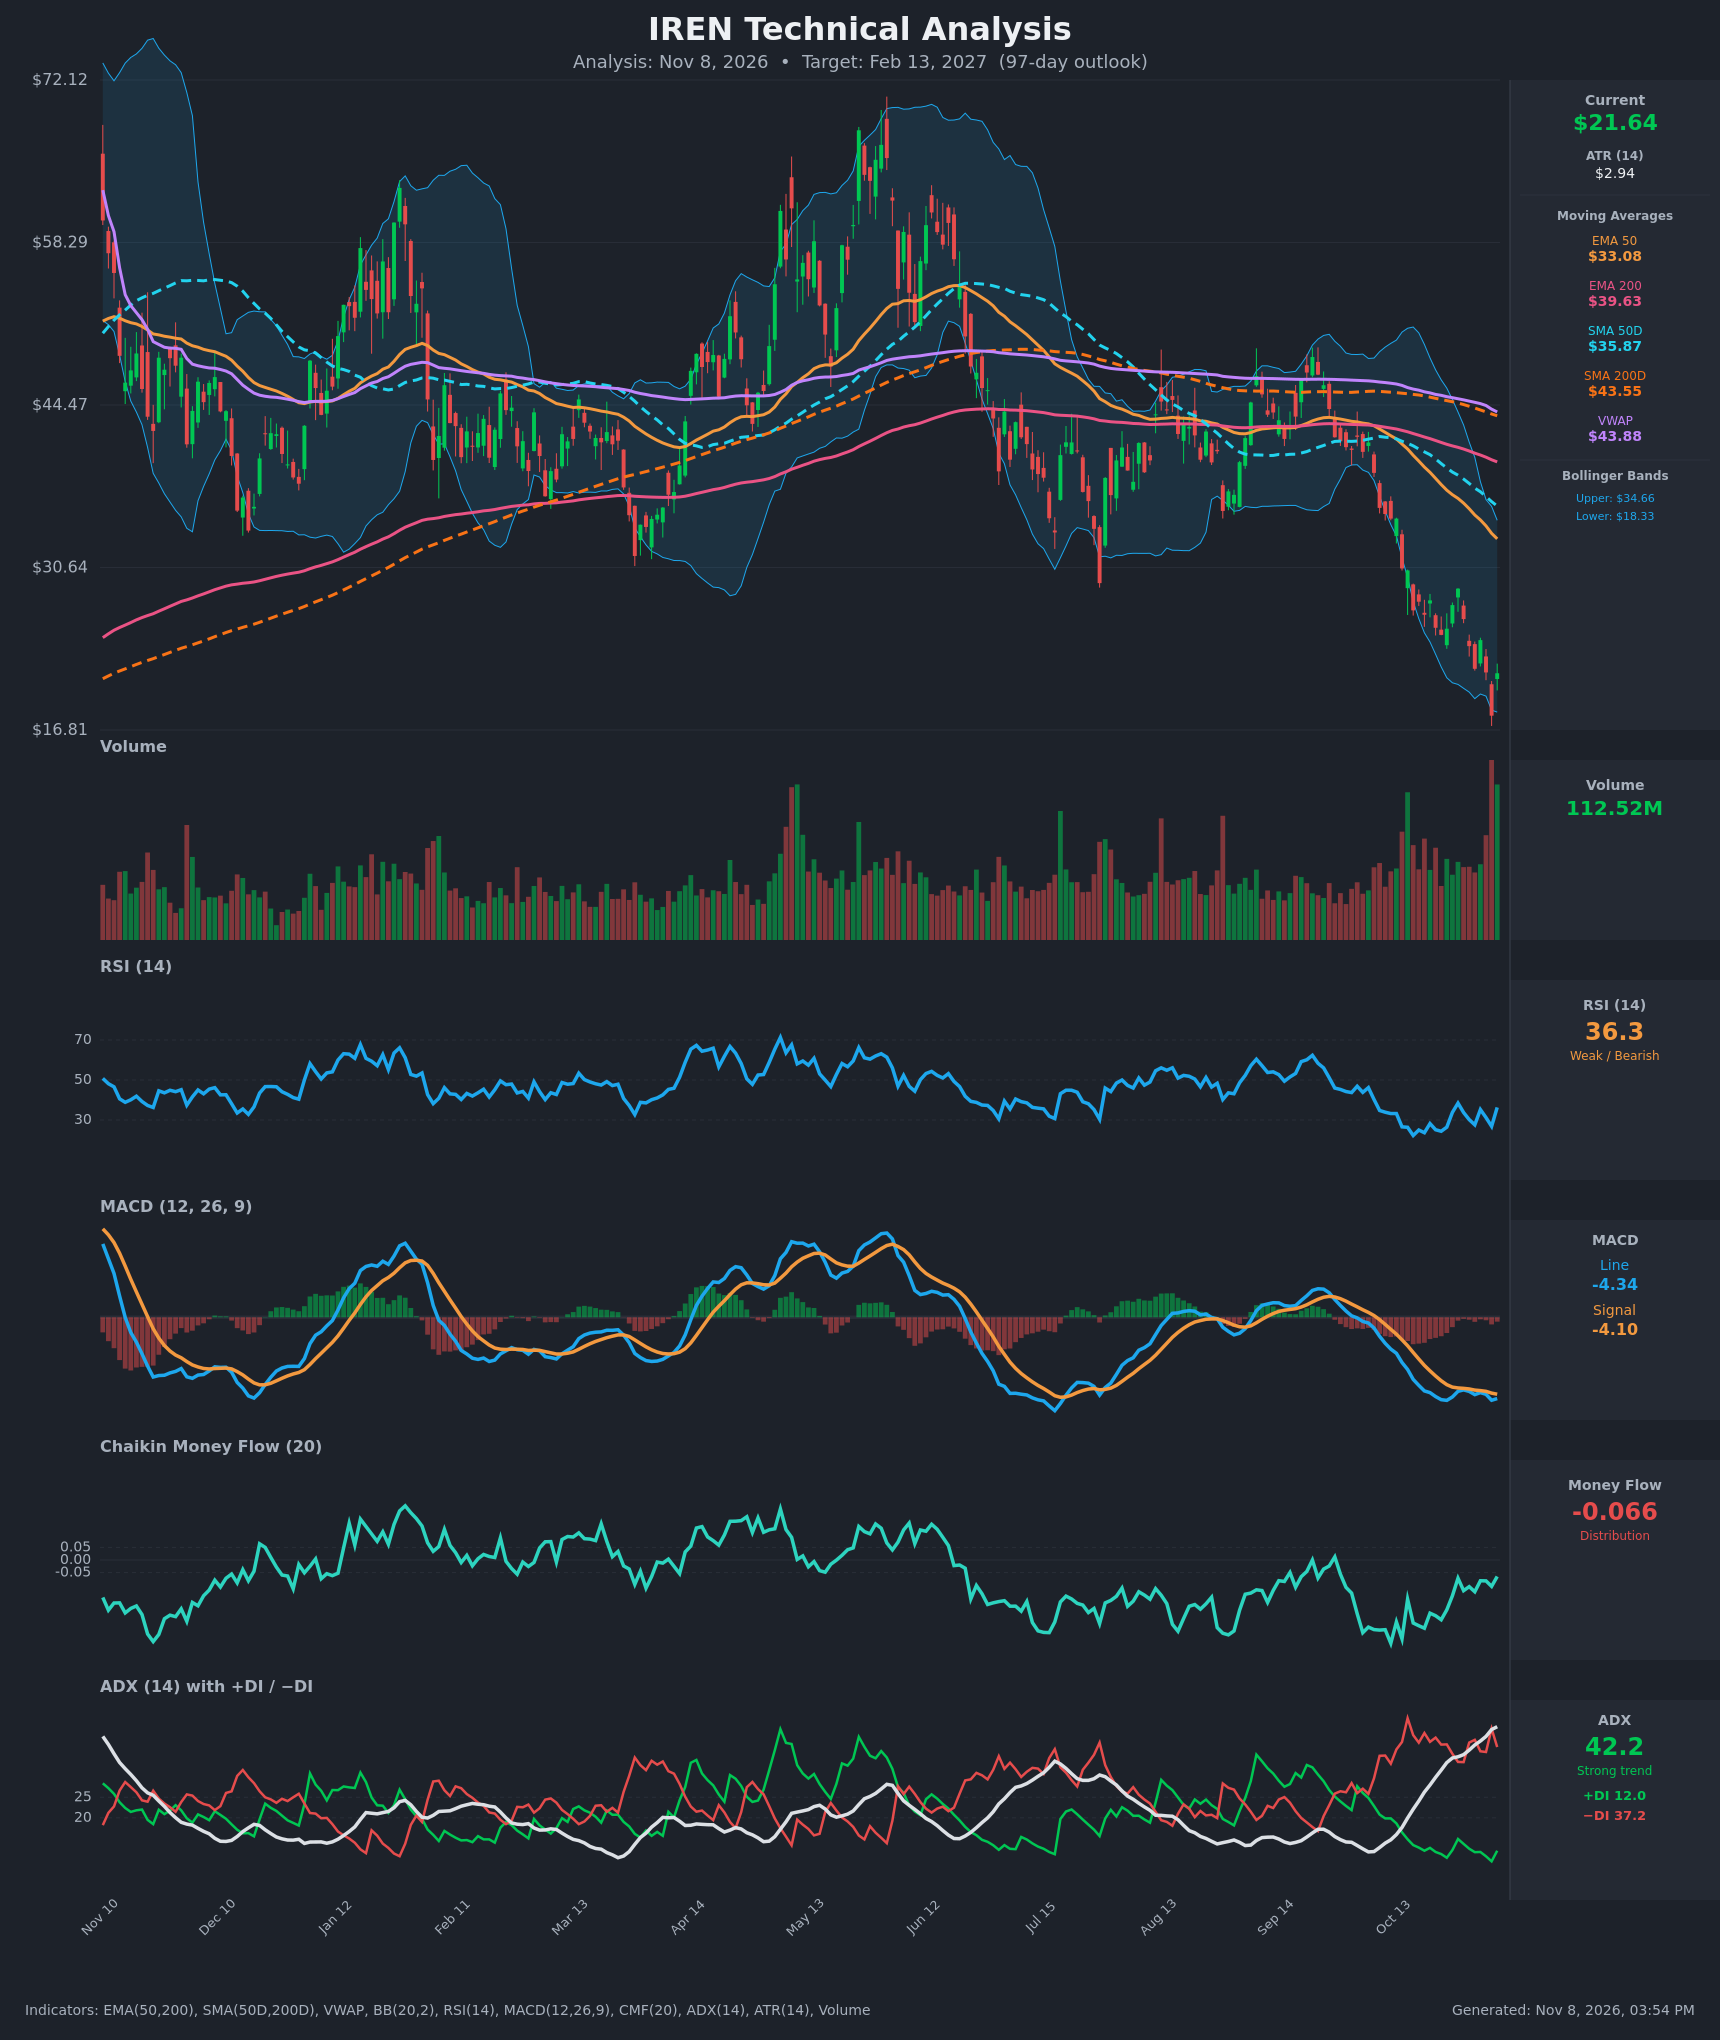
- RSI (14): 36.29. It bounced from 26.8 on Nov 5 but remains below 40 and has been in the 23-38 zone for three weeks. It is not oversold now, and the bounce is just a relief move within a downtrend. [Bearish]
- 20 EMA: The 20 EMA is not provided. The EMA 50 at $33.08 is about 53% above price and falling, and the EMA 200 at $39.63 sits above that. Price is far below the whole moving-average stack, so rallies face heavy overhead resistance. [Bearish]
- MACD: Line -4.335 is below signal -4.103, with a slightly negative histogram of about -0.23. Both lines are deeply negative, and the line has been below the signal for most of the last 15 bars. The line is flattening, which hints at decelerating downside momentum but no bullish cross yet. [Bearish]
- Bollinger Bands (20): Upper $34.66, lower $18.33, midline about $26.50. Price at $21.64 is in the lower half after the Nov 5 close at $18.03 pierced the lower band. The bands are wide, and the price has walked the lower band. The bounce back inside the bands is a mean-reversion bounce at best. [Bearish]
- CMF (20): -0.066, just below the -0.05 threshold. It has improved from -0.27 on Oct 20 but is still in mild distribution. Sellers remain in control, though pressure is easing. [Distribution]
- ADX (14): 42.2 and rising, with -DI 37.2 well above +DI 12.0. This is a strong, established downtrend, and the ADX is near its highest level on the chart. A reading this high can mean the trend is mature and exhaustion or a relief rally is possible. [Strong Trend - Bearish]
- Volume: 112.52M, a spike at the highest level of the chart over the last two days. Nov 5 was a heavy-volume selloff that looks like capitulation, followed by a green high-volume bounce on Nov 6. This could mark a short-term low, but it needs confirmation. [Capitulation / Possible Short-Term Bottom]
DIVERGENCES & TRENDS
- Death cross: SMA50D ($35.87) is well below SMA200D ($43.55), and EMA50 is below EMA200. This is a confirmed long-term bearish structure.
- Price vs. long-term averages: Price is below SMA200D, EMA200 and VWAP ($43.88), which is a clear long-term downtrend. VWAP is about 50% above price.
- Possible mild divergence: RSI made a low of about 23.6 on Oct 20 and 26.8 on Nov 5, while price made a lower low at $18.03. This is a minor bullish RSI divergence, supported by the MACD line flattening around -4.3 to -4.4.
- Volume capitulation: Record-volume down and up days at the lows often signal a selling climax. Even so, no trend reversal is confirmed.
- DI and ADX: -DI dominates and ADX keeps rising, so the trend is still intensifying.
- MACD: No bullish crossover. The line and signal are converging slowly.
- Price structure: The decline from about $44 in late Sep/Oct to $18 is a steep waterfall of roughly 55%.
CHART PATTERNS
- Primary structure: A large topping and distribution phase ran from June to September, with highs around $68 in May and a series of lower highs. The range failed, then broke down through $35-36 into a waterfall. This resembles a bearish head-and-shoulders or triple-top breakdown pattern from the reference diagram, with a large measured move lower.
- Current structure: Price is in a steep downtrend and has hit a possible capitulation low at $18.03. The bounce to $21.64 may form a bearish flag or a basing/double-bottom attempt.
- Targets: The pattern breakdown measure points well below the neckline area, so the $15-18 zone is plausible for retests. A bullish double bottom would need a rally above about $24-28 to confirm. Resistance sits at $25-28, followed by $33-35 (EMA50 and the lower range).
POTENTIAL SCENARIOS
- Scenario 1: Bearish Continuation / Retest of Lows — The relief bounce fades beneath $26-28 and sellers press again, retesting or breaking the $18 capitulation low. Trigger: rejection at $25-28 with a daily close below $19. Target: $16-18. Invalidation: daily close above $28 on rising volume. (45% probability)
- Scenario 2: Neutral Base-Building Range — After the capitulation, price builds a base between about $17.50 and $28 with mean reversion. Trigger: holding above $18 with falling ADX and improving CMF. Target: $20-26 range. Invalidation: close below $17.50 or above $30. (30% probability)
- Scenario 3: Bullish Relief Rally / Reversal — The capitulation volume marks a bottom, a MACD bullish cross develops, and price rallies toward the EMA50 and the lower Bollinger midline. Trigger: close above $26.50 (mid-band) and +DI crossing above -DI. Target: $30-34. Invalidation: close below $18. (25% probability)
PRICE TARGETS
Timeframe: 97 days (target date about Feb 13, 2027). Range width should be about 18-30% of current price; I use about 51% of price because ATR is high at $2.94 (about 13.6% of price) and volatility is extreme, which justifies a wider band than the formula minimum.
- Target Price: $19.50 (the trend and momentum favor a retest and slightly lower trading, but capitulation volume tempers the downside)
- Expected Range: $14.50 to $27.50 (width $13.00, about 60% of current price; wider than the standard 18-30% guidance because IREN's ATR is about 13.6% of price)
- Key Levels: Support at $18.03, Resistance at $26.50
OVERALL BIAS
OVERALL BIAS: BEARISH - Price is far below a bearish moving-average stack with a confirmed death cross, -DI dominating at ADX 42, MACD below signal and CMF in mild distribution. The capitulation volume and minor RSI divergence argue for a volatile base, but the weight of evidence favors a retest of the lows.
This is educational analysis and not financial advice.