MARA 97-day bearish forecast — Nov 8, 2026
- Bias: Bearish
- Timeframe: 97 days (made Nov 8, 2026, target date Feb 12, 2027)
- Price at analysis: $6.35
- Price target: $5.75
- Expected range: $4.95 – $6.85
- Result: Pending — graded after the close on Feb 12, 2027
Get a free AI analysis of MARA today
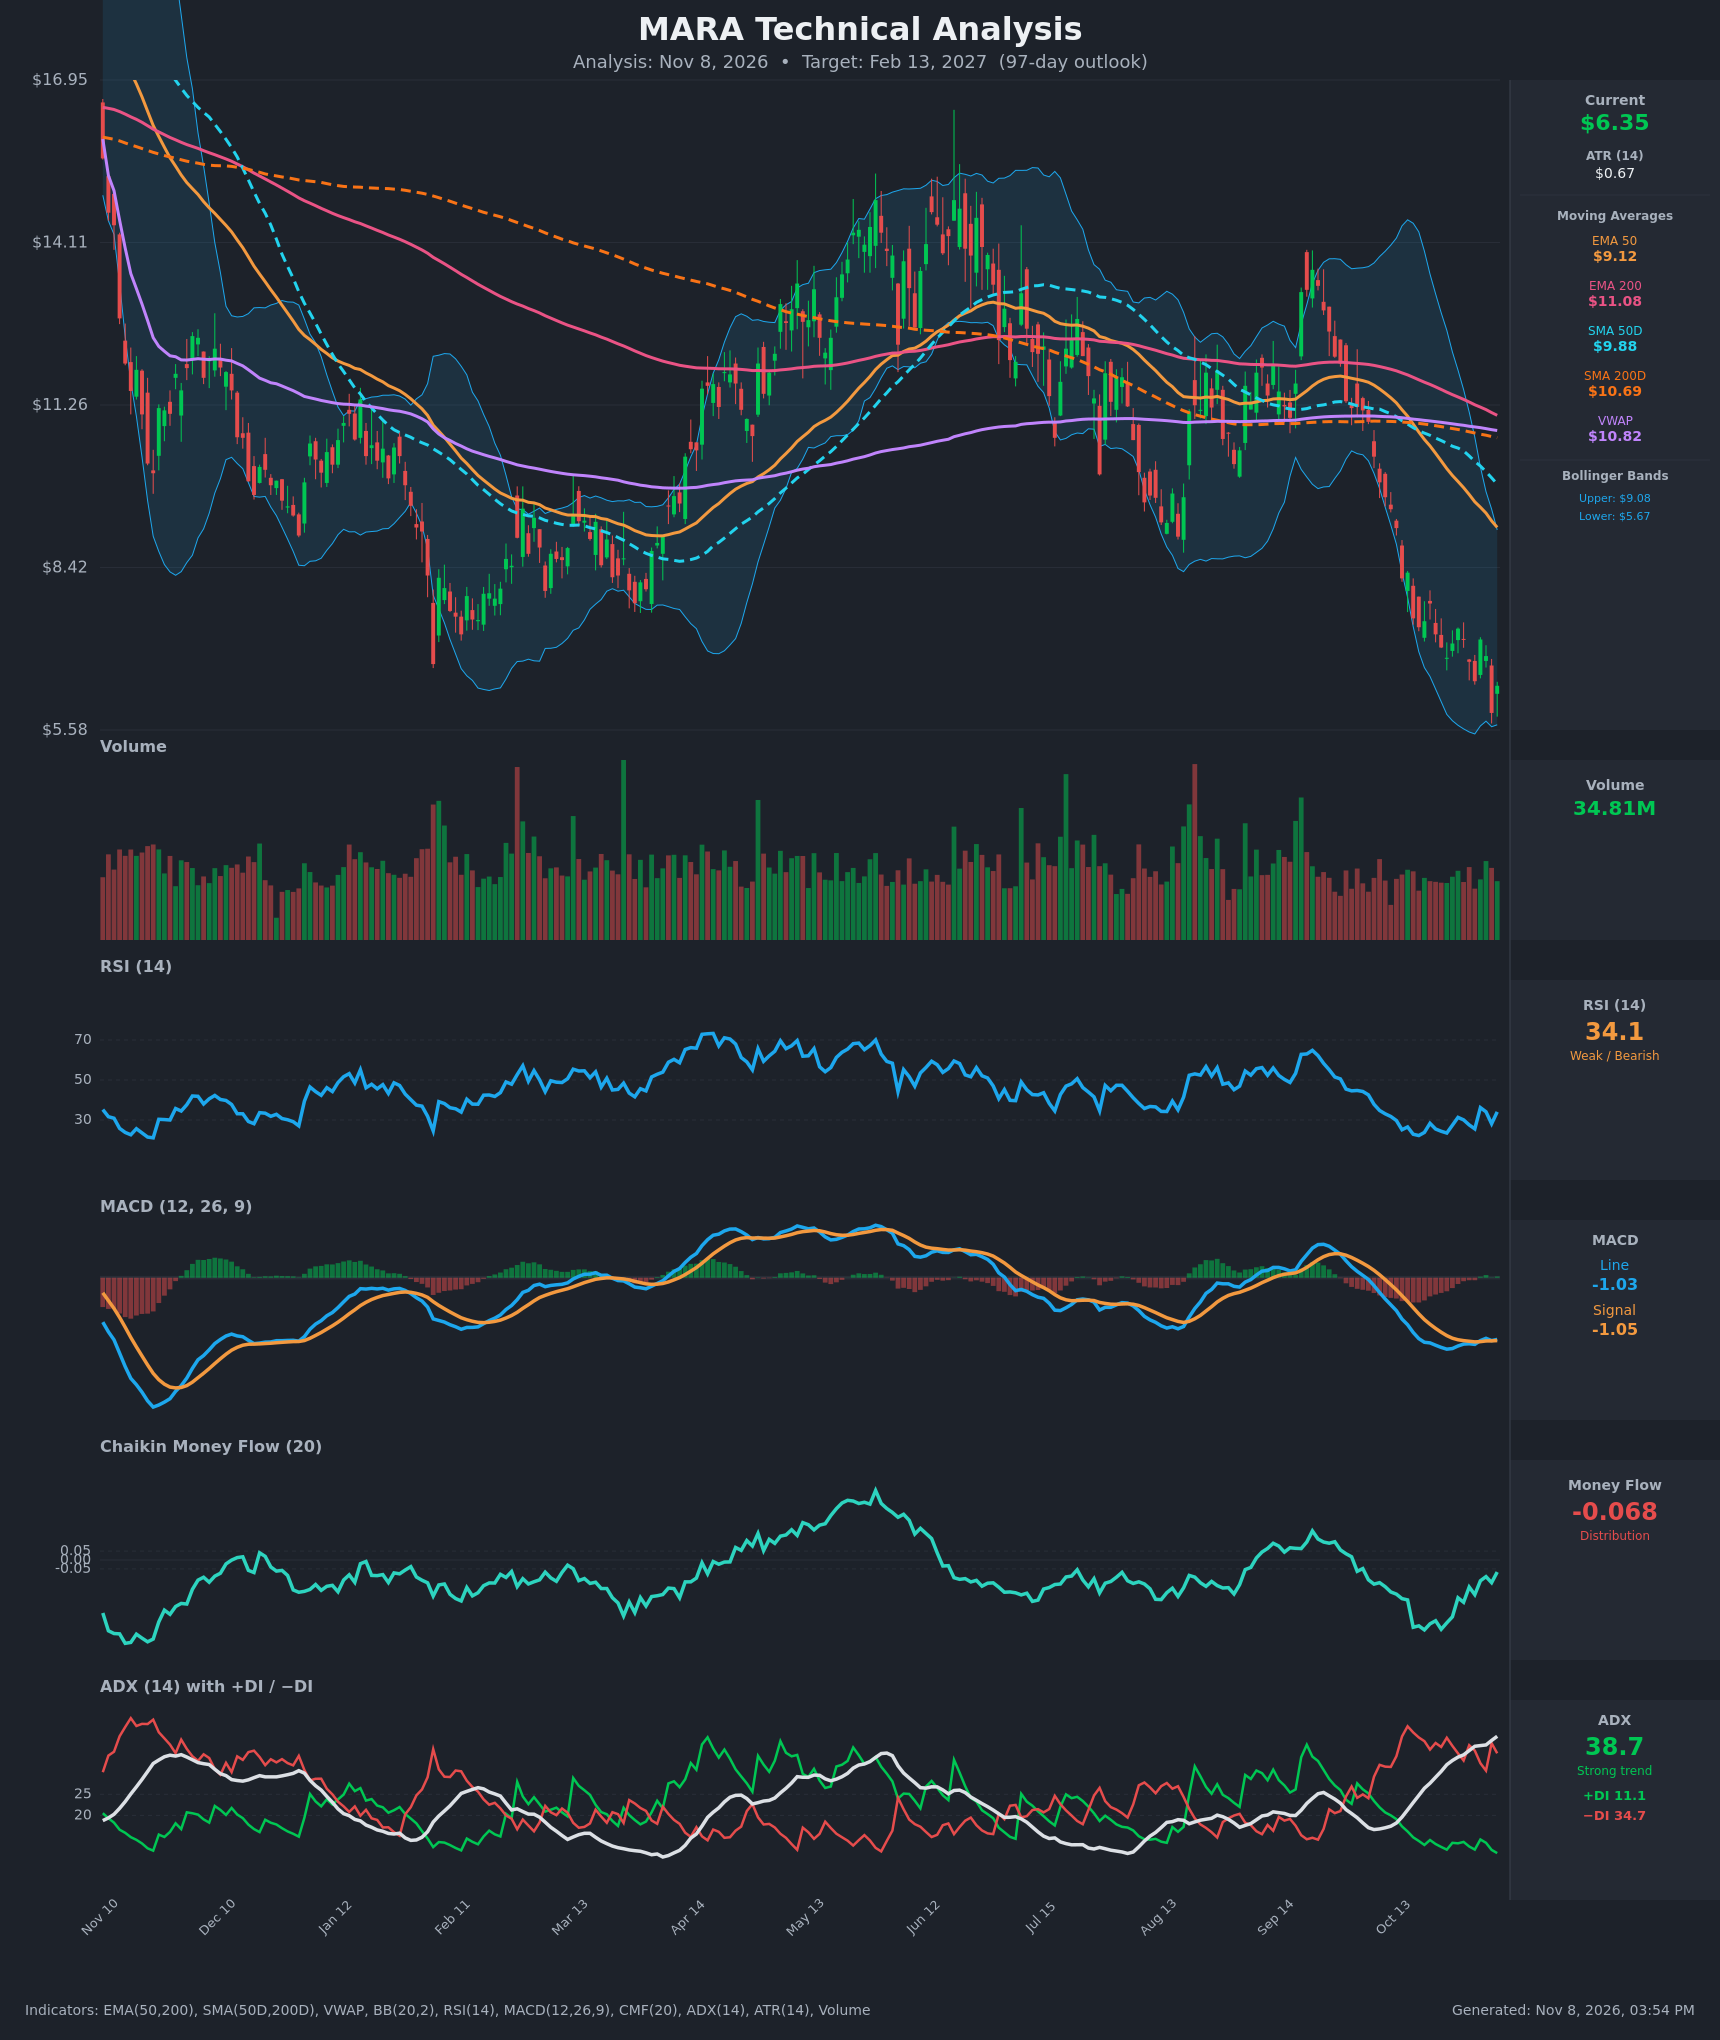
Analysis
TECHNICAL INDICATORS
- RSI (14): 34.07, just above oversold. It bottomed at 22 on Oct 19 and has since made a series of higher lows (23.5, 25.6, 28.1) and bounced from 28.1 to 34.1 in one session. Momentum is still weak, but selling pressure is easing. [Bearish]
- 20 EMA: The 20 EMA is not provided. The EMA 50 is $9.12 and falling about $0.12 per bar. Price at $6.35 is roughly 30% below it, so the EMA 50 and the EMA 200 ($11.08) act as heavy overhead resistance. EMA 50 has been below EMA 200 throughout the recent data, a bearish alignment. [Bearish]
- MACD: Line -1.026 is barely above signal -1.046, a histogram of about +0.02. The line crossed above the signal on Nov 3, but both sit deep below zero and the cross is tiny. This is a flattening of bearish momentum, not a real reversal signal. [Neutral]
- Bollinger Bands (20): Upper $9.08, lower $5.67, so price sits in the lower quarter of the bands. The Nov 5 close of $5.88 tested the lower band and price rebounded. The bands are still sloping down and the bands are wide, so the volatility regime is high. A lower-band ride is typical of a trending decline. [Bearish]
- CMF (20): -0.068, below the -0.05 threshold, so it still shows mild distribution. It has improved sharply from -0.39 on Oct 20, so selling pressure is fading. It has not yet turned positive, which would signal accumulation. [Distribution]
- ADX (14): 38.7 and rising, with -DI at 34.7 far above +DI at 11.1. This is a strong, mature downtrend with bears firmly in control. A reading near 40 can also signal trend exhaustion if it rolls over. [Strong Trend – Bearish]
- Volume: 34.81M, roughly average. The chart shows no large capitulation spike at the lows, and the bounces occur on unremarkable volume. A washout-type volume climax has not yet occurred. [Neutral to Mildly Bearish]
DIVERGENCES & TRENDS
- RSI divergence: Price made lower lows (6.84, then 5.88) while RSI lows were 23.5 and 28.1, a mild bullish divergence. It hints at a relief bounce but does not confirm a trend reversal.
- MACD: The line is flat to slightly rising versus the signal after bottoming near -1.19. Momentum is stabilizing, but it is still deeply negative.
- CMF: It has recovered from -0.39 to -0.07 while price made new lows. That is another early bullish divergence, though it is still below -0.05.
- Moving averages: Price is below EMA 50, EMA 200, SMA 50D ($9.88), SMA 200D ($10.69) and VWAP ($10.82). The SMA 50D has already crossed below the SMA 200D (death cross), and both SMAs are still falling.
- ADX/DI: -DI has dominated +DI since early Oct, and ADX is rising. The trend is intact and has not yet shown exhaustion.
- Price structure: The decline from about $14 in September to $6.35 is steep. The Oct 19 to Nov 6 bounces failed at lower highs ($7.79, then $7.35, then $7.16).
CHART PATTERNS
- Bearish Flag/Pennant (continuation): Following the sharp drop from the mid-$13s, the Oct 19 to Nov 6 consolidation of $6.4–$7.8 with lower highs resembles a bearish flag. The Nov 5 break to $5.88 fits the continuation. A measured move of the prior leg is extreme and would project toward the low $5s or lower.
- Bullish Falling Wedge (possible alternative): The converging lower highs and lower lows, together with the RSI/CMF divergences, could be forming a falling wedge. This needs a breakout above about $7.40–$7.80 to confirm. It is not confirmed yet, so it is the minority case.
- Target logic: Failure to hold $5.60–$5.88 opens a leg toward $5.00 or lower. A reclaim of $7.80 would invalidate the flag.
POTENTIAL SCENARIOS
- Scenario 1: Bearish Trend Continuation — The strong downtrend (ADX 38.7, -DI 34.7) continues, with rallies capped by the falling EMA 50 and prior lower highs. Trigger: a daily close below $5.58–$5.67 (lower Bollinger Band and recent low). Target: $5.00–$5.50, with an extension toward $4.80 if momentum accelerates. Invalidation: a daily close above $7.80. (50% probability)
- Scenario 2: Bullish Relief Bounce / Mean Reversion — Oversold conditions and the RSI/CMF divergences fuel a bounce toward the declining moving averages. Trigger: a close above $7.40 (recent lower high) and CMF turning above +0.05. Target: $7.80–$8.50, with a stretch toward the EMA 50 area near $9. Invalidation: a close below $5.58. (35% probability)
- Scenario 3: Neutral Base-Building Range — Price stabilizes in a $5.60–$7.40 range as the downtrend exhausts, with MACD flattening and ADX rolling over. Trigger: repeated holds above $5.60 and failures near $7.40. Target: $6.20–$6.60. Invalidation: a break outside the $5.58–$7.80 range. (15% probability)
PRICE TARGETS
For 97 days (Feb 13, 2027):
- Target Price: $5.75
- Expected Range: $4.95 to $6.85 (width $1.90, about 29.9% of current price, within the 18–30% guidance for 61–180 days)
- Key Levels: Support at $5.60, Resistance at $7.35
OVERALL BIAS
OVERALL BIAS: BEARISH - Price is below every major moving average, ADX is near 39 with -DI far above +DI, and a death cross is in place. Early divergences in RSI and CMF argue for a bounce, but they have not yet reversed the trend structure, so continuation toward the low $5s is the more probable outcome.
This is educational analysis and not financial advice.