MSTR 97-day bearish forecast — Nov 8, 2026
- Bias: Bearish
- Timeframe: 97 days (made Nov 8, 2026, target date Feb 12, 2027)
- Price at analysis: $128.93
- Price target: $117.00
- Expected range: $104.00 – $138.00
- Result: Pending — graded after the close on Feb 12, 2027
Get a free AI analysis of MSTR today
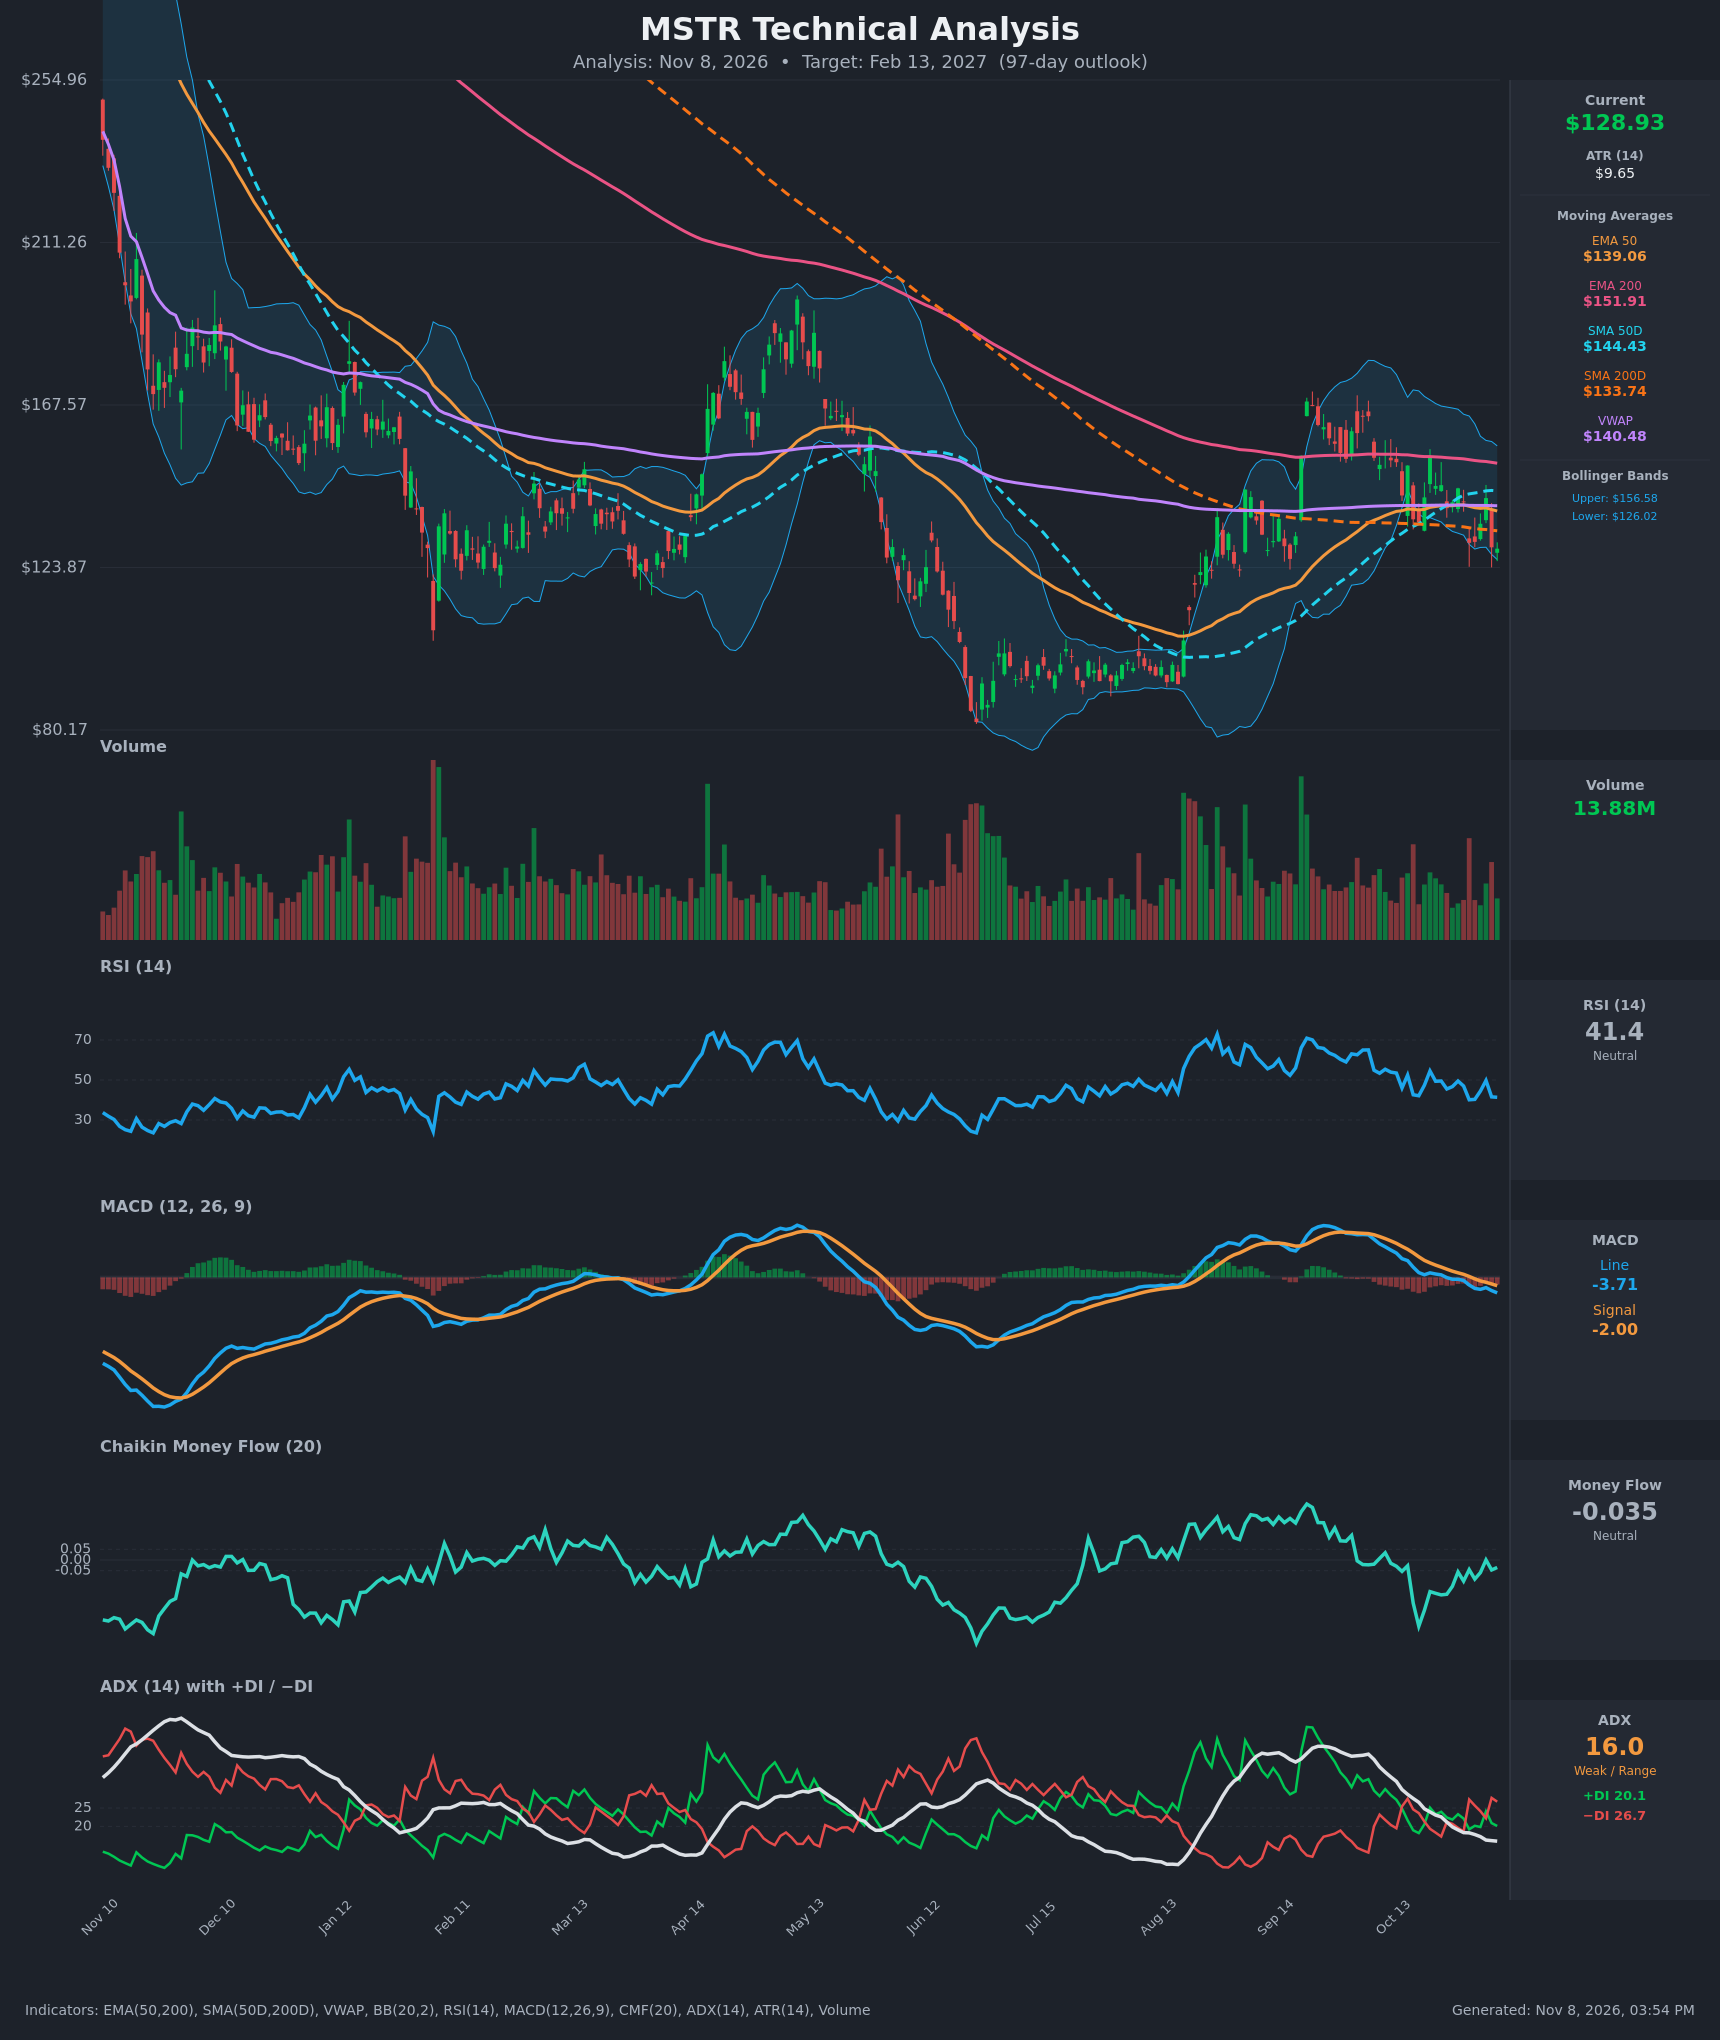
Analysis
TECHNICAL INDICATORS
- RSI (14): 41.35, below the 50 midline but above oversold. It has been capped near 50 on every bounce (49.7 on Nov 4) and has turned down again, so momentum is soft. [Bearish]
- 20 EMA: No 20 EMA value was supplied, so I use the EMA 50 as the nearest guide. EMA 50 is $139.06 and falling. Price at $128.93 is about 7% below it, and it now acts as resistance. EMA 50 is also well below EMA 200 ($151.91), a bearish long-term structure. [Bearish]
- MACD: Line -3.71 is below signal -2.00, with a widening negative histogram. The bearish crossover happened around Oct 26-Nov 2, and the gap has kept widening since. [Bearish]
- Bollinger Bands (20): Upper $156.58, lower $126.02. Price is in the lower quarter of the bands, about $2.90 above the lower band, and the bands are narrowing. There is no clean squeeze, but a close below $126 would show downside expansion. A bounce toward the mid-band (~$141) is also plausible. [Neutral]
- CMF (20): -0.035, inside the ±0.05 neutral band. It has recovered from about -0.31 in late October and is no longer in heavy distribution, but it has not turned positive. [Neutral]
- ADX (14): 16.0 and falling, so the trend is weak or range-bound. −DI (26.7) is above +DI (20.1), so bears have the slight edge. This is a low-conviction downtrend, not a strong one. [Weak Trend, Bearish lean]
- Volume: 13.88M, near average, with no capitulation spike. The most recent red bars are slightly heavier than the green ones, but there is no decisive volume signal. [Neutral to mildly Bearish]
DIVERGENCES & TRENDS
- Moving averages: Price is below EMA 50, EMA 200, SMA 50D ($144.43), VWAP ($140.48) and SMA 200D ($133.74). The SMA 200D loss is recent and is the key technical break.
- Golden cross fading: SMA 50D is still above SMA 200D, but the gap is narrowing (SMA 50D slipped from $144.60 to $144.43 as SMA 200D fell to $133.74). A death cross is possible in coming months if price does not reclaim $140+.
- No divergence: RSI has not made a higher low against price, so there is no bullish divergence. RSI and MACD confirm the price weakness.
- Failed rally: The Oct 21 spike to $153.48 was fully retraced within 2 weeks, a failed breakout above the EMA 200 area.
- DI crossover: −DI crossed back above +DI on Oct 30 and has stayed there. The ADX decline from 26 to 16 shows the bounce is losing trend energy.
CHART PATTERNS
- Range after the Aug-Sep rally: Price has swung between roughly $128 and $155-170 since September, with lower highs. This loosely resembles a Bearish Pennant or Bearish Flag after the rally. It is not a clean match, and an unconfirmed flag or pennant leans toward continuation lower.
- Lower highs: The sequence of lower highs (~$170 in Sep, ~$153 in Oct) with support near $126-128 looks like a Descending Triangle forming. A break below $126 would project toward the $105-115 area.
- Longer-term context: The Jun-Aug base near $95 is the large higher-low zone and the major support if the pattern resolves down.
- Bullish counter: A Double Bottom is possible if $126-128 holds, with a neckline near $145-153. No reversal is confirmed yet.
POTENTIAL SCENARIOS
- Scenario 1: Bearish Breakdown Below Range Support — Price loses the $126 lower Bollinger Band and the descending-triangle support, with MACD staying negative and −DI dominant. Trigger: daily close below $126 on rising volume. Target: $115-$110, with an extension toward $104. Invalidation: a daily close above $140 (EMA 50 and VWAP). (50% probability)
- Scenario 2: Bullish Range Hold and Recovery — $126-128 holds, CMF turns positive, and price retakes SMA 200D and the EMA 50. Trigger: close above $134, then $140. Target: $145-$152 (SMA 50D, EMA 200). Invalidation: a close below $124. (30% probability)
- Scenario 3: Neutral Chop — Weak ADX keeps price between $122 and $142. Trigger: failure to close beyond either $126 or $140. Target: $128-$135. Invalidation: a close outside the $120-$145 band. (20% probability)
PRICE TARGETS
For the 97-day horizon (target date ~Feb 13, 2027):
- Target Price: $117.00
- Expected Range: $104.00 to $138.00 (width $34 = ~26% of current price, consistent with the 61-180 day guidance)
- Key Levels: Support at $120.00 (prior March-April lows; $126.02 lower Bollinger Band is the first line), Resistance at $133.74 (SMA 200D; then $139.06 EMA 50 and $140.48 VWAP)
OVERALL BIAS
OVERALL BIAS: BEARISH - Price is below every key moving average except none holding as support, MACD is in a widening bearish crossover, −DI leads +DI, and the bounces keep failing under $153 with lower highs. The weak ADX (16) and neutral CMF keep conviction modest, so a hold of $126-128 is the main risk to this view.
This is educational analysis and not financial advice.