NIO 97-day bearish forecast — Nov 8, 2026
- Bias: Bearish
- Timeframe: 97 days (made Nov 8, 2026, target date Feb 12, 2027)
- Price at analysis: $3.39
- Price target: $3.18
- Expected range: $2.78 – $3.62
- Result: Pending — graded after the close on Feb 12, 2027
Get a free AI analysis of NIO today
Analysis
TECHNICAL INDICATORS
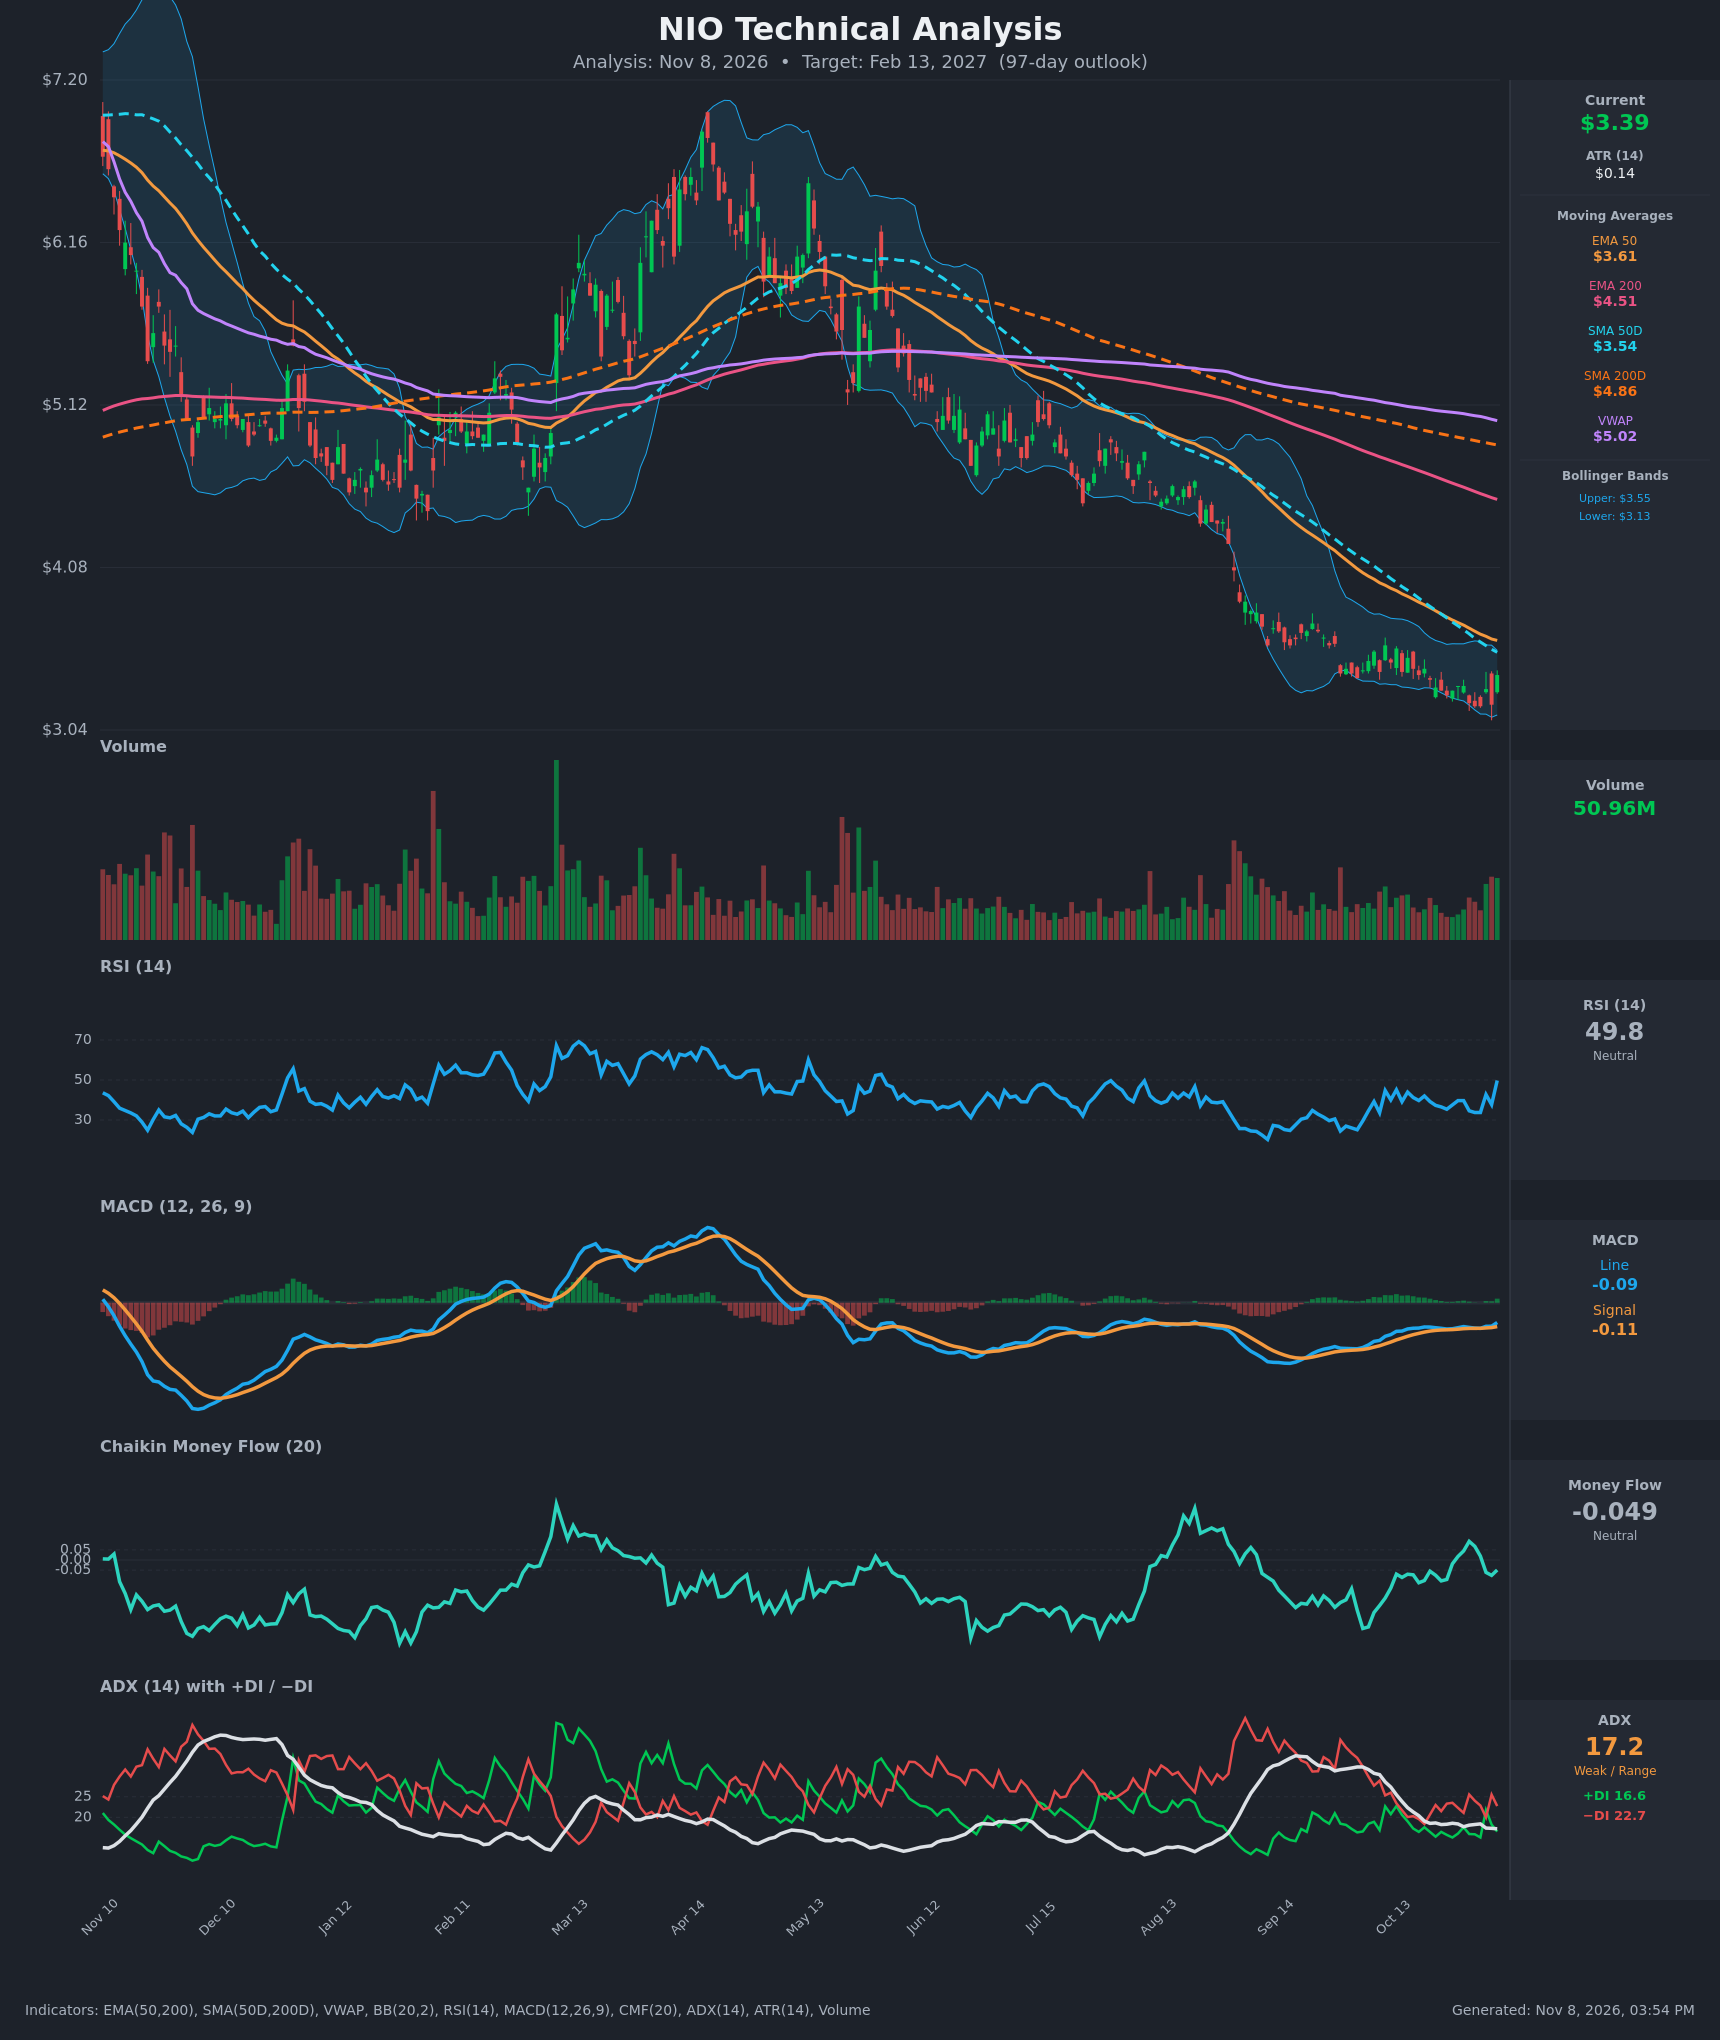
- RSI (14): 49.76, up sharply from 33.7 on Nov 3 and now back at the midline. Momentum has recovered from near-oversold, but 50 has capped the rebounds repeatedly during this downtrend. [Neutral]
- 20 EMA: The 20 EMA isn't supplied, so I use the 50 EMA at $3.61 as the nearest dynamic reference. Price at $3.39 is below it, and the EMA is still sloping down (about $3.86 to $3.61 in 15 bars). It acts as overhead resistance. [Bearish]
- MACD: Line at -0.090 versus signal at -0.108, giving a small positive histogram of about +0.018. The line crossed above the signal around Nov 3-4, a bullish crossover, but both lines are still below zero and the move is shallow. [Bullish]
- Bollinger Bands (20): Upper $3.548, lower $3.134, midline about $3.34. Price spent weeks riding the lower band and has now bounced above the midline. The bands are narrow after a long grind, which points to compression and a coming volatility expansion with no direction signal. [Neutral]
- CMF (20): -0.049, just inside the neutral zone. It was positive (up to +0.09) in late Oct to early Nov and has rolled back to the distribution threshold. Buyers are not showing sustained accumulation. [Neutral]
- ADX (14): 17.2 with +DI 16.6 and −DI 22.7. The trend is weak (<20) but −DI is on top, so sellers still have the slight edge. The trend has faded, not reversed. [Weak Trend, Bearish lean]
- Volume: 50.96M, with a cluster of green bars on the latest bounce, which is somewhat above the recent quiet average. It is not a capitulation or breakout volume spike, so it shows interest without conviction. [Neutral / mild bullish]
- Long-term MAs and VWAP: Price is below the SMA50 ($3.54), SMA200 ($4.86), EMA200 ($4.51) and VWAP ($5.02). Both the EMA and SMA death crosses are long in the past, so the structural trend is firmly down. [Bearish]
DIVERGENCES & TRENDS
- Mild bullish divergence: Price made a new low at $3.19 (Nov 2-3) while RSI bottomed at 33.7, well above the roughly 25 low of September. MACD lows are also higher. Selling momentum is fading.
- Trend structure: Price has fallen from about $5.8 (Aug) to about $3.2, a decline of more than 40%, with lower highs and lower lows. All moving averages are stacked bearishly (price < SMA50 < EMA200 < SMA200 < VWAP).
- Crossovers: The MACD bullish crossover is the only major positive. A bullish +DI/−DI crossover briefly flashed on Nov 4 but failed the next day. The SMA50 ($3.54) is now converging with price and will act as a ceiling.
- ADX: It has dropped from about 33 (Aug-Sep) to 17. The selloff is losing steam, which favors a base or a sideways phase, not an immediate acceleration.
CHART PATTERNS
- Primary: Bearish Flag / Rectangle-style consolidation (continuation). After the sharp September-October drop, price has stalled in a tight $3.19-$3.50 range. Within a downtrend, this resembles a flag or base that more often resolves lower. The measured move from the prior leg (about $4.5 to $3.4) would point to $2.5-$2.8 if support fails.
- Alternative: Bullish Falling Wedge / double-bottom hint. The Oct 30-Nov 3 lows near $3.19 form a double-bottom-like base, supported by the RSI/MACD divergence. Confirmation would need a close above about $3.55 (the SMA50 and upper band), with an initial target near $3.95-$4.10.
- Significance: The bullish base is not confirmed. Overhead supply from the EMA50 ($3.61) and SMA50 ($3.54) sits within 4-6% of price.
POTENTIAL SCENARIOS
- Scenario 1: Bearish Range Failure / Trend Continuation — Price fails at the SMA50/EMA50 resistance cluster ($3.54-$3.61) and rolls back into the $3.19 low. A break would resume the downtrend, given −DI dominance and the stacked bearish MAs. Trigger: rejection at $3.55-$3.61 and a daily close below $3.19. Target: $3.00-$3.15, with an extension to about $2.80. Invalidation: daily close above $3.62. (45% probability)
- Scenario 2: Bullish Base Breakout / Short Squeeze — The RSI/MACD divergence and the double-bottom at $3.19 lead to a breakout above the moving-average cluster, with volume expansion from the compressed Bollinger Bands. Trigger: close above $3.62 on rising volume. Target: $3.95-$4.10. Invalidation: close below $3.19. (33% probability)
- Scenario 3: Neutral Sideways Chop — Weak ADX keeps price between $3.15 and $3.60 for most of the window. Trigger: repeated failures at both ends of the range. Target: $3.30-$3.45. Invalidation: close outside $3.10-$3.65. (22% probability)
PRICE TARGETS
For the 97-day timeframe (to about Feb 13, 2027):
- Target Price: $3.18
- Expected Range: $2.78 to $3.62 (width $0.84, about 24.8% of current price, consistent with the 18-30% guidance for 61-180 days)
- Key Levels: Support at $3.19, Resistance at $3.54
OVERALL BIAS
OVERALL BIAS: BEARISH - Price remains below every major moving average and VWAP with −DI above +DI, and the SMA50/EMA50 cluster at $3.54-$3.61 is immediate resistance. The bullish MACD crossover and RSI divergence are real but unconfirmed, so a drift back toward or below the $3.19 low is the more likely outcome, though conviction is modest.
This is educational analysis and not financial advice.