PFE 97-day bullish forecast — Nov 8, 2026
- Bias: Bullish
- Timeframe: 97 days (made Nov 8, 2026, target date Feb 12, 2027)
- Price at analysis: $29.39
- Price target: $30.80
- Expected range: $26.80 – $33.30
- Result: Pending — graded after the close on Feb 12, 2027
Get a free AI analysis of PFE today
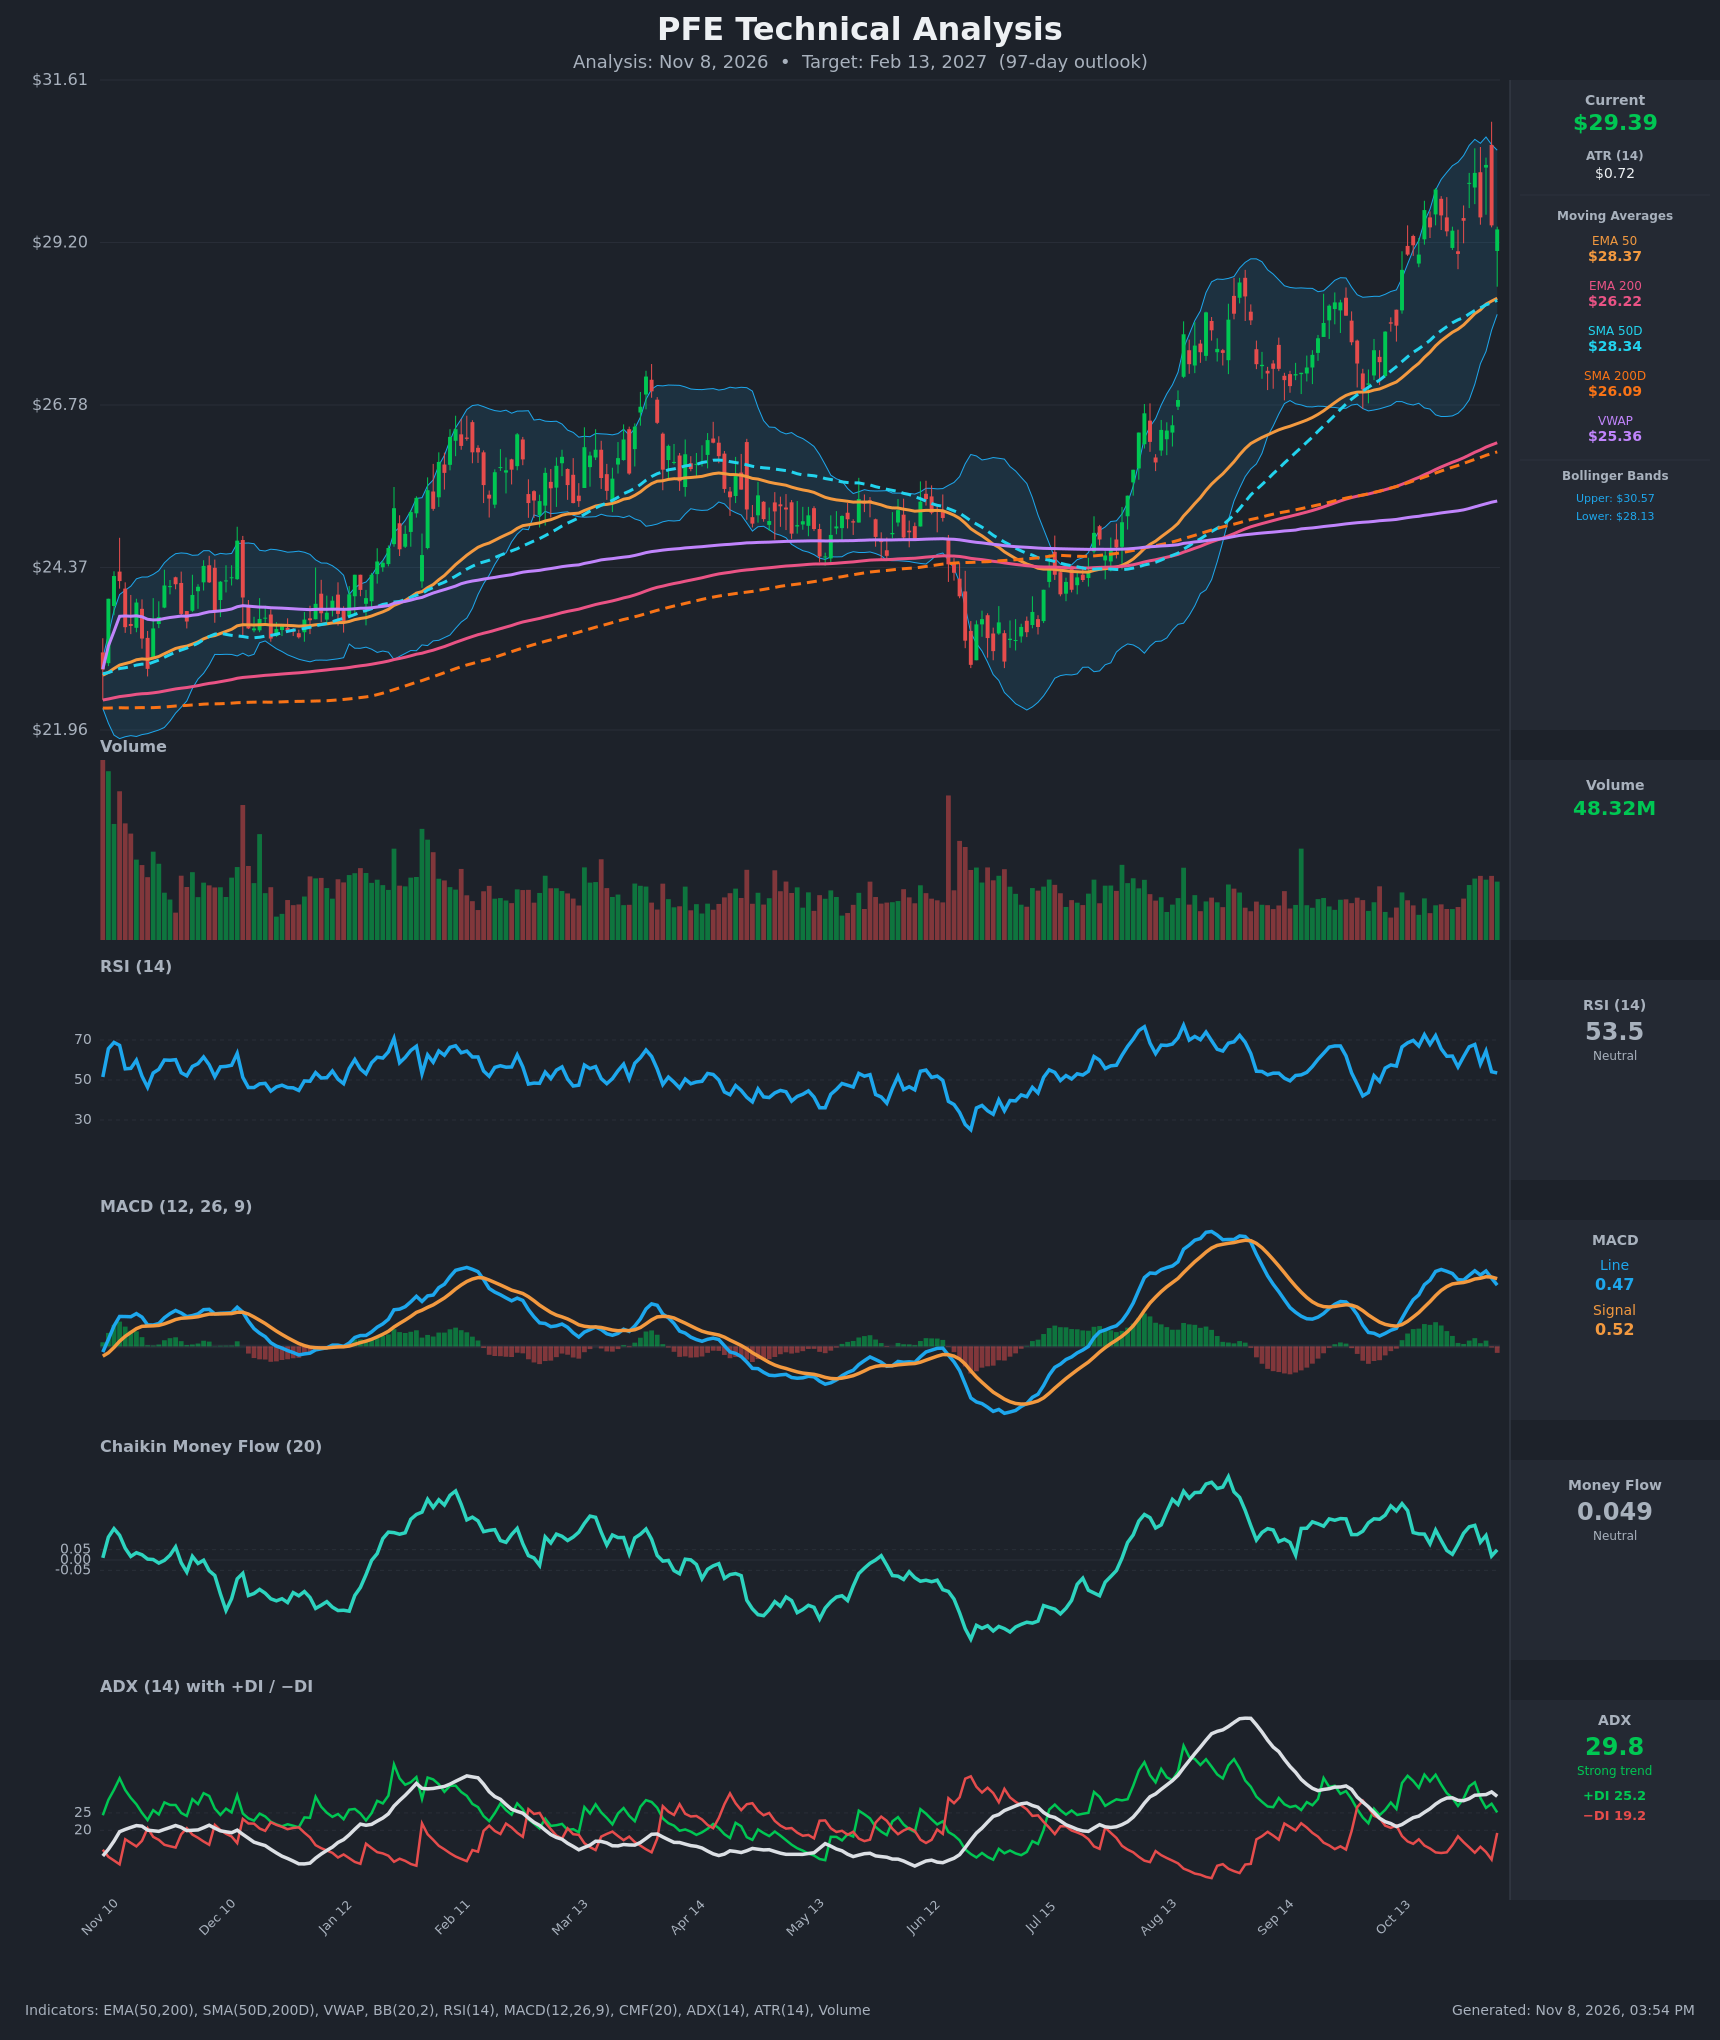
Analysis
TECHNICAL INDICATORS
- RSI (14): 53.52, down from 72.7 on Oct 20 and 72.2 on Oct 22. It has dropped back to the midline after repeated overbought readings. The lower highs in momentum show the push above $30 is losing steam, but it is still above 50. [Neutral]
- 20 EMA: No 20 EMA value was supplied. The EMA 50 ($28.37) and SMA 50D ($28.34) are the closest proxies, and price at $29.39 sits about 3.6% above both. That is the first dynamic support and the trend is intact. [Bullish]
- MACD: Line 0.466 against signal 0.515 gives a fresh bearish crossover on Nov 6 (the line was above the signal on Nov 5, 0.519 vs 0.528 was already narrowing). The histogram has just turned negative at about -0.05. The line is still positive, so this is a momentum pause rather than a trend reversal. [Bearish]
- Bollinger Bands (20): Upper $30.57, lower $28.13, middle about $29.35. Price is right at the midline after tagging the upper band at $30.35 on Nov 4 and being rejected. The bands are wide, and a close below the midline would open a test of $28.13. [Neutral]
- CMF (20): 0.049 is just under the +0.05 accumulation threshold, down from 0.167 on Nov 2. Buying pressure is fading and the reading sits right at the neutral boundary. [Neutral]
- ADX (14): 29.8 with +DI 25.2 over −DI 19.2. The trend is strong and bulls still control it. However, +DI has dropped from 36 to 25 and −DI has risen from 11.6 to 19.2 in two sessions, so directional dominance is narrowing. [Strong Trend + Bullish, weakening]
- Volume: 48.32M, elevated against the preceding months, with several high-volume bars during the recent run-up. The large red candle with a long upper wick near $30.3 on rising volume hints at some supply/distribution at the highs. [Neutral to cautious]
DIVERGENCES & TRENDS
- Price made higher highs ($29.98 → $30.08 → $30.35) while RSI made lower highs (72.7 → 67.7 → 64.5). This is a mild bearish RSI divergence over the short term.
- MACD peaked near 0.585 on Oct 23 and has not made a new high, even as price pushed higher. This is a second sign of momentum divergence.
- MACD has crossed below its signal line, and +DI has crossed lower relative to −DI. These are early signs of a pullback.
- The long-term structure is strongly bullish. The golden cross is in place (SMA50D $28.34 above SMA200D $26.09). EMA50 is above EMA200 ($28.37 vs $26.22). Price is above the SMA200D, and the rising VWAP is far below price.
- Price is about 16% above the SMA200D and above the 50-day averages, which are rising steeply. That extension makes a pullback toward $28.3 plausible without breaking the uptrend.
CHART PATTERNS
- Bullish Flag / Rectangle consolidation (continuation): After the strong Aug–Oct advance from about $24.5 to $30.3, price is consolidating between about $29.0 and $30.35. A breakout above $30.4 would project a measured move of roughly $32–33.
- Bearish Double/Triple Top (reversal, minor risk): Highs at $30.08, $30.23 and $30.35 form a flat ceiling near $30.2–30.4. A close below the neckline around $29.0 would signal a move toward the EMA50 / SMA50 and lower BB near $28.1–28.4. A full reversal would need a break below $28.1.
- On balance, the larger trend favors the continuation structure. The top pattern is a lower-probability risk that would only become dominant on a break below $28.1.
POTENTIAL SCENARIOS
- Scenario 1: Bullish Pullback-and-Continuation — Price retests the EMA50/SMA50 zone near $28.3–28.4, holds, then resumes the uptrend and breaks the $30.35 ceiling. Trend structure (golden cross, strong ADX, rising MAs) supports continuation. Trigger: Hold of $28.3 followed by a daily close above $30.60. Target: $31.50–$33.00. Invalidation: Daily close below $27.80. (50% probability)
- Scenario 2: Bearish Failed Breakout / Top Reversal — The MACD bearish cross, RSI divergence and fading CMF lead to a breakdown from the $30.2–30.4 triple top. Price loses the EMA50/SMA50 and the lower Bollinger Band. Trigger: Close below $28.10. Target: $26.20–$27.00 (EMA200/SMA200D area). Invalidation: Reclaim of $30.60. (30% probability)
- Scenario 3: Neutral Range Consolidation — Price chops between $28.3 and $30.4 for weeks as momentum resets. Trigger: Failure to close outside the $28.3–$30.4 range. Target: $28.8–$30.0. Invalidation: Close outside the range on volume. (20% probability)
PRICE TARGETS
- Target Price: $30.80 (97 days)
- Expected Range: $26.80 to $33.30 (width $6.50, about 22% of the current price, consistent with the 61–180 day guidance of 18–30%)
- Key Levels: Support at $28.30 (EMA50/SMA50D, with the lower BB at $28.13 just beneath it), Resistance at $30.60 (the Bollinger upper band and the recent high zone of $30.35)
OVERALL BIAS
OVERALL BIAS: BULLISH - The long-term trend is strong, with a golden cross, price above all moving averages, ADX near 30 and +DI above −DI. The near-term MACD cross, RSI divergence and faded CMF suggest a pullback toward $28.3 first, but the trend favors resumption over the 97-day horizon.
This is educational analysis and not financial advice.