QUBT 97-day bearish forecast — Nov 8, 2026
- Bias: Bearish
- Timeframe: 97 days (made Nov 8, 2026, target date Feb 12, 2027)
- Price at analysis: $6.33
- Price target: $5.75
- Expected range: $4.85 – $6.75
- Result: Pending — graded after the close on Feb 12, 2027
Get a free AI analysis of QUBT today
Analysis
TECHNICAL INDICATORS
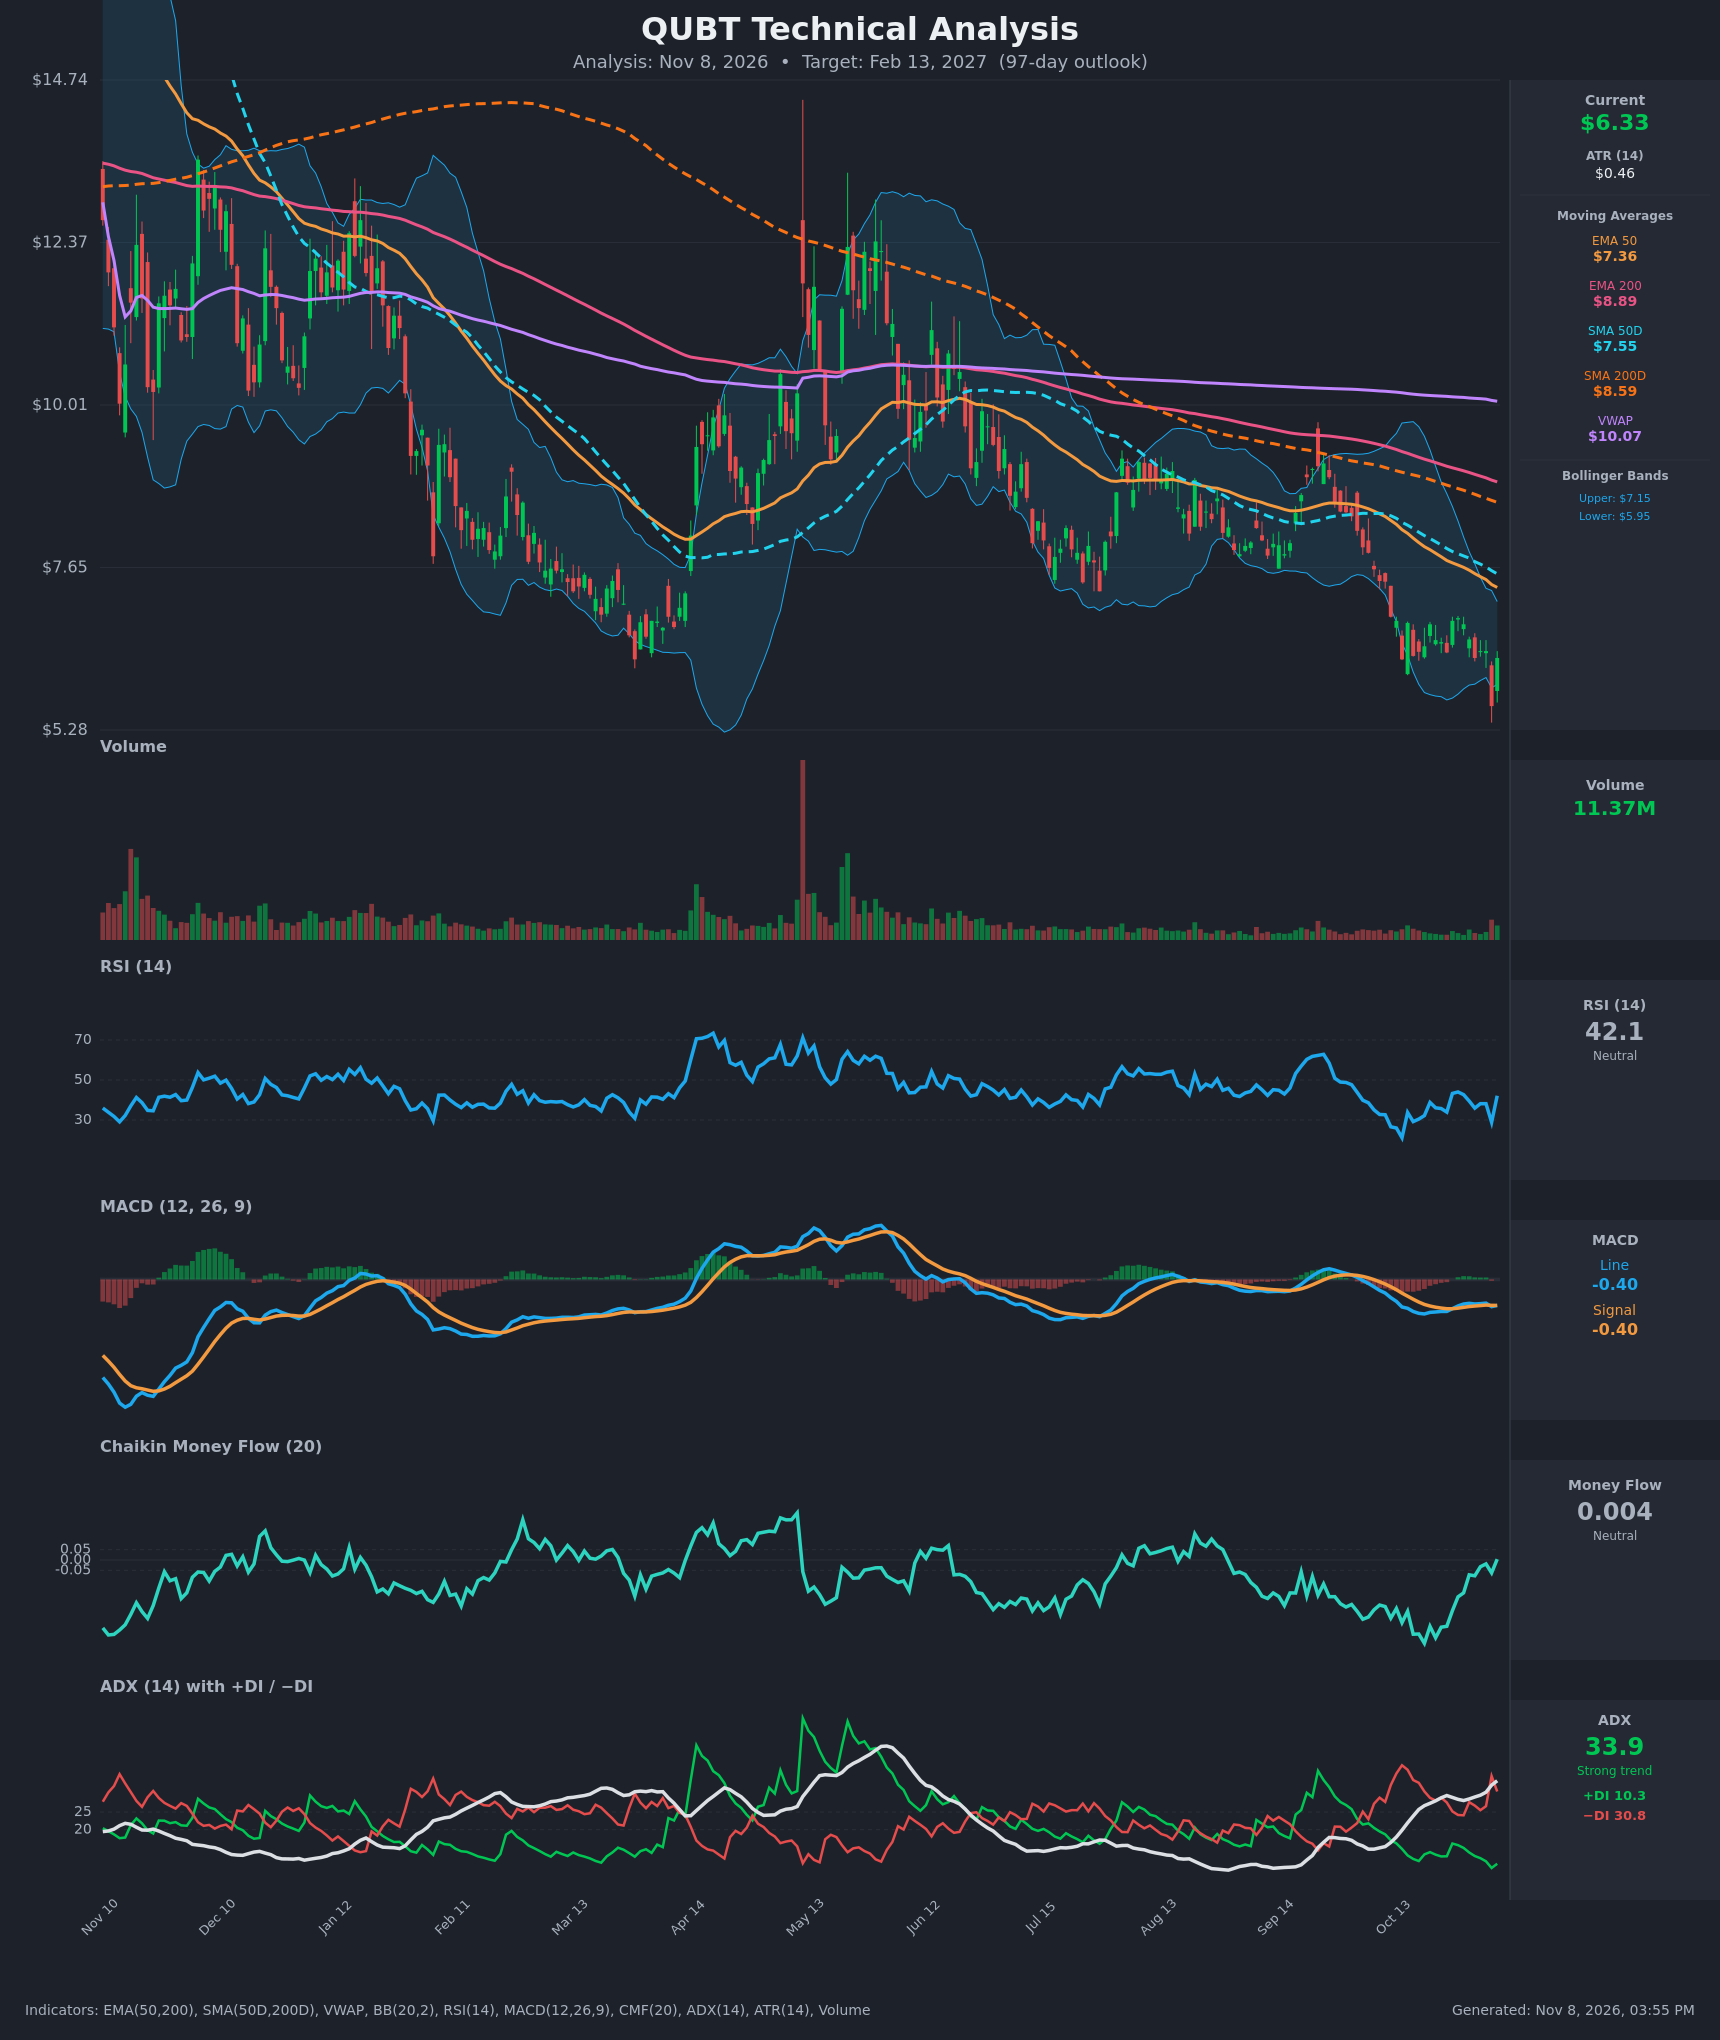
- RSI (14): 42.13, up from 28.9 on Nov 5 after the oversold flush. It is still below 50, and the recent peaks (44 on Oct 28) failed under 45. Momentum is recovering but has not turned bullish. [Neutral]
- 20 EMA: The 20-period EMA is not supplied. The 20-period Bollinger midline is about $6.55, and price at $6.33 sits below it. The EMA50 ($7.36) is well overhead and falling about $0.04-0.05 per day. [Bearish]
- MACD: The line (-0.3957) and signal (-0.3953) are essentially identical, so the histogram is flat at zero. The line crossed back below the signal on Nov 5 (-0.414) and has just recovered to the signal. Both are negative, below the zero line, and flat. This is a tentative bearish stance with little momentum either way. [Bearish]
- Bollinger Bands (20): The bands run $5.95 to $7.15, so price at $6.33 is in the lower third. The Nov 5 close of $5.63 pierced the lower band and snapped back inside. The bands are fairly narrow, but the trend is down, so a lower-band "walk" is possible. [Bearish]
- CMF (20): 0.004, neutral. It has climbed from -0.40 (Oct 20) to zero, which means selling pressure is easing, but there is no real accumulation yet. [Neutral]
- ADX (14): 33.9 and rising, with −DI (30.8) far above +DI (10.3). This is a strong, established downtrend with bears firmly in control. [Strong Trend – Bearish]
- Volume: 11.37M, low compared with the spikes earlier in the year. Volume has faded through the decline, so the bounce is not backed by conviction buying. It also shows no capitulation-style climax. [Weak bounce / Bearish-leaning]
Moving-average structure is fully bearish:
- Price ($6.33) is below EMA50 ($7.36), EMA200 ($8.89), SMA50 ($7.55), SMA200 ($8.59) and VWAP ($10.07).
- EMA50 is below EMA200 and SMA50 is below SMA200, so a death cross is in place on both pairs, and the gaps are still widening.
DIVERGENCES & TRENDS
- Bullish divergences (short-term):
- RSI printed 28.9 on Nov 5 against 30.5 on Oct 19, a similar or slightly higher low, while price made a lower low at $5.63.
- CMF rose from -0.36 to about 0 while price made new lows. This hints at seller exhaustion.
- Bearish trend context:
- ADX has climbed from about 26 to 34 as −DI stays far above +DI.
- The MAs are stacked in bear order and every rally has stalled at falling resistance.
- Lower highs run from Sep to Oct, and lower lows came on Oct 13 and Nov 5.
- Crossovers and breaks:
- MACD is converging on its signal line but has not crossed up decisively.
- Price broke below the Sep-Oct base around $7.5-8.0 and is now at the bottom of the chart's range ($5.28 low).
- The chart shows no golden cross, and the death cross persists.
CHART PATTERNS
- Descending channel / Bearish Flag-Pennant (continuation): After the sharp drop from about $8 to $6.4, price has consolidated in a tight $6.3-$6.9 range with small candles on declining volume. This resembles the bearish flag/pennant on the reference diagram. A break below $6.30 (and especially below $5.63) projects a measured move of about the prior leg, roughly $1.5, which points to the $4.80-5.00 zone.
- Bullish Falling Wedge (counter-case): The Nov 5 flush with a snap-back, plus the RSI and CMF divergences, could form a falling wedge or double-bottom base around $5.63. It would need a close above $6.90 and then $7.36 to confirm. The pattern is incomplete and unconfirmed.
- Overall: Continuation (bearish) has the edge given ADX, the DI spread and the MA stack.
POTENTIAL SCENARIOS
- Scenario 1: Bearish Trend Continuation — The downtrend resumes. Price loses the $5.63 swing low and the lower band, and the bear-flag measured move plays out over the next 3 months. Trigger: daily close below $5.63 with −DI staying above 30. Target: $5.00, with a possible extension to $4.85. Invalidation: daily close above $7.15, then $7.36. (50% probability)
- Scenario 2: Bullish Relief Rally / Base Formation — Divergences resolve upward. Price holds $5.63 and rallies back toward the declining EMA50 and SMA50. The rally stalls there because the MAs are resistance. Trigger: close above $6.91 with MACD crossing up and CMF above +0.05. Target: $7.35-7.55. Invalidation: close below $5.63. (32% probability)
- Scenario 3: Neutral Choppy Base — Price stays inside $5.60-$6.90 and ADX gradually fades. Trigger: continued low-volume sideways candles. Target: $6.20-$6.40. Invalidation: close outside $5.60-$6.90. (18% probability)
PRICE TARGETS
- Target Price: $5.75 (97 days, about Feb 13, 2027)
- Expected Range: $4.85 to $6.75 (width $1.90, about 30% of the current price, consistent with the 61-180 day guidance)
- Key Levels: Support at $5.63, Resistance at $7.36
OVERALL BIAS
OVERALL BIAS: BEARISH - ADX of 33.9 with −DI (30.8) far above +DI (10.3), price below every moving average and VWAP, and a persisting death cross make the downtrend dominant. The bear-flag consolidation on fading volume has a measured-move target near $5. The bullish RSI and CMF divergences argue for a relief bounce, but a bounce into the $7.15-$7.55 resistance zone would more likely offer a lower high than a reversal.
This is educational analysis and not financial advice.