SLV 97-day bearish forecast — Nov 8, 2026
- Bias: Bearish
- Timeframe: 97 days (made Nov 8, 2026, target date Feb 12, 2027)
- Price at analysis: $46.87
- Price target: $42.50
- Expected range: $38.00 – $50.00
- Result: Pending — graded after the close on Feb 12, 2027
Get a free AI analysis of SLV today
Analysis
TECHNICAL INDICATORS
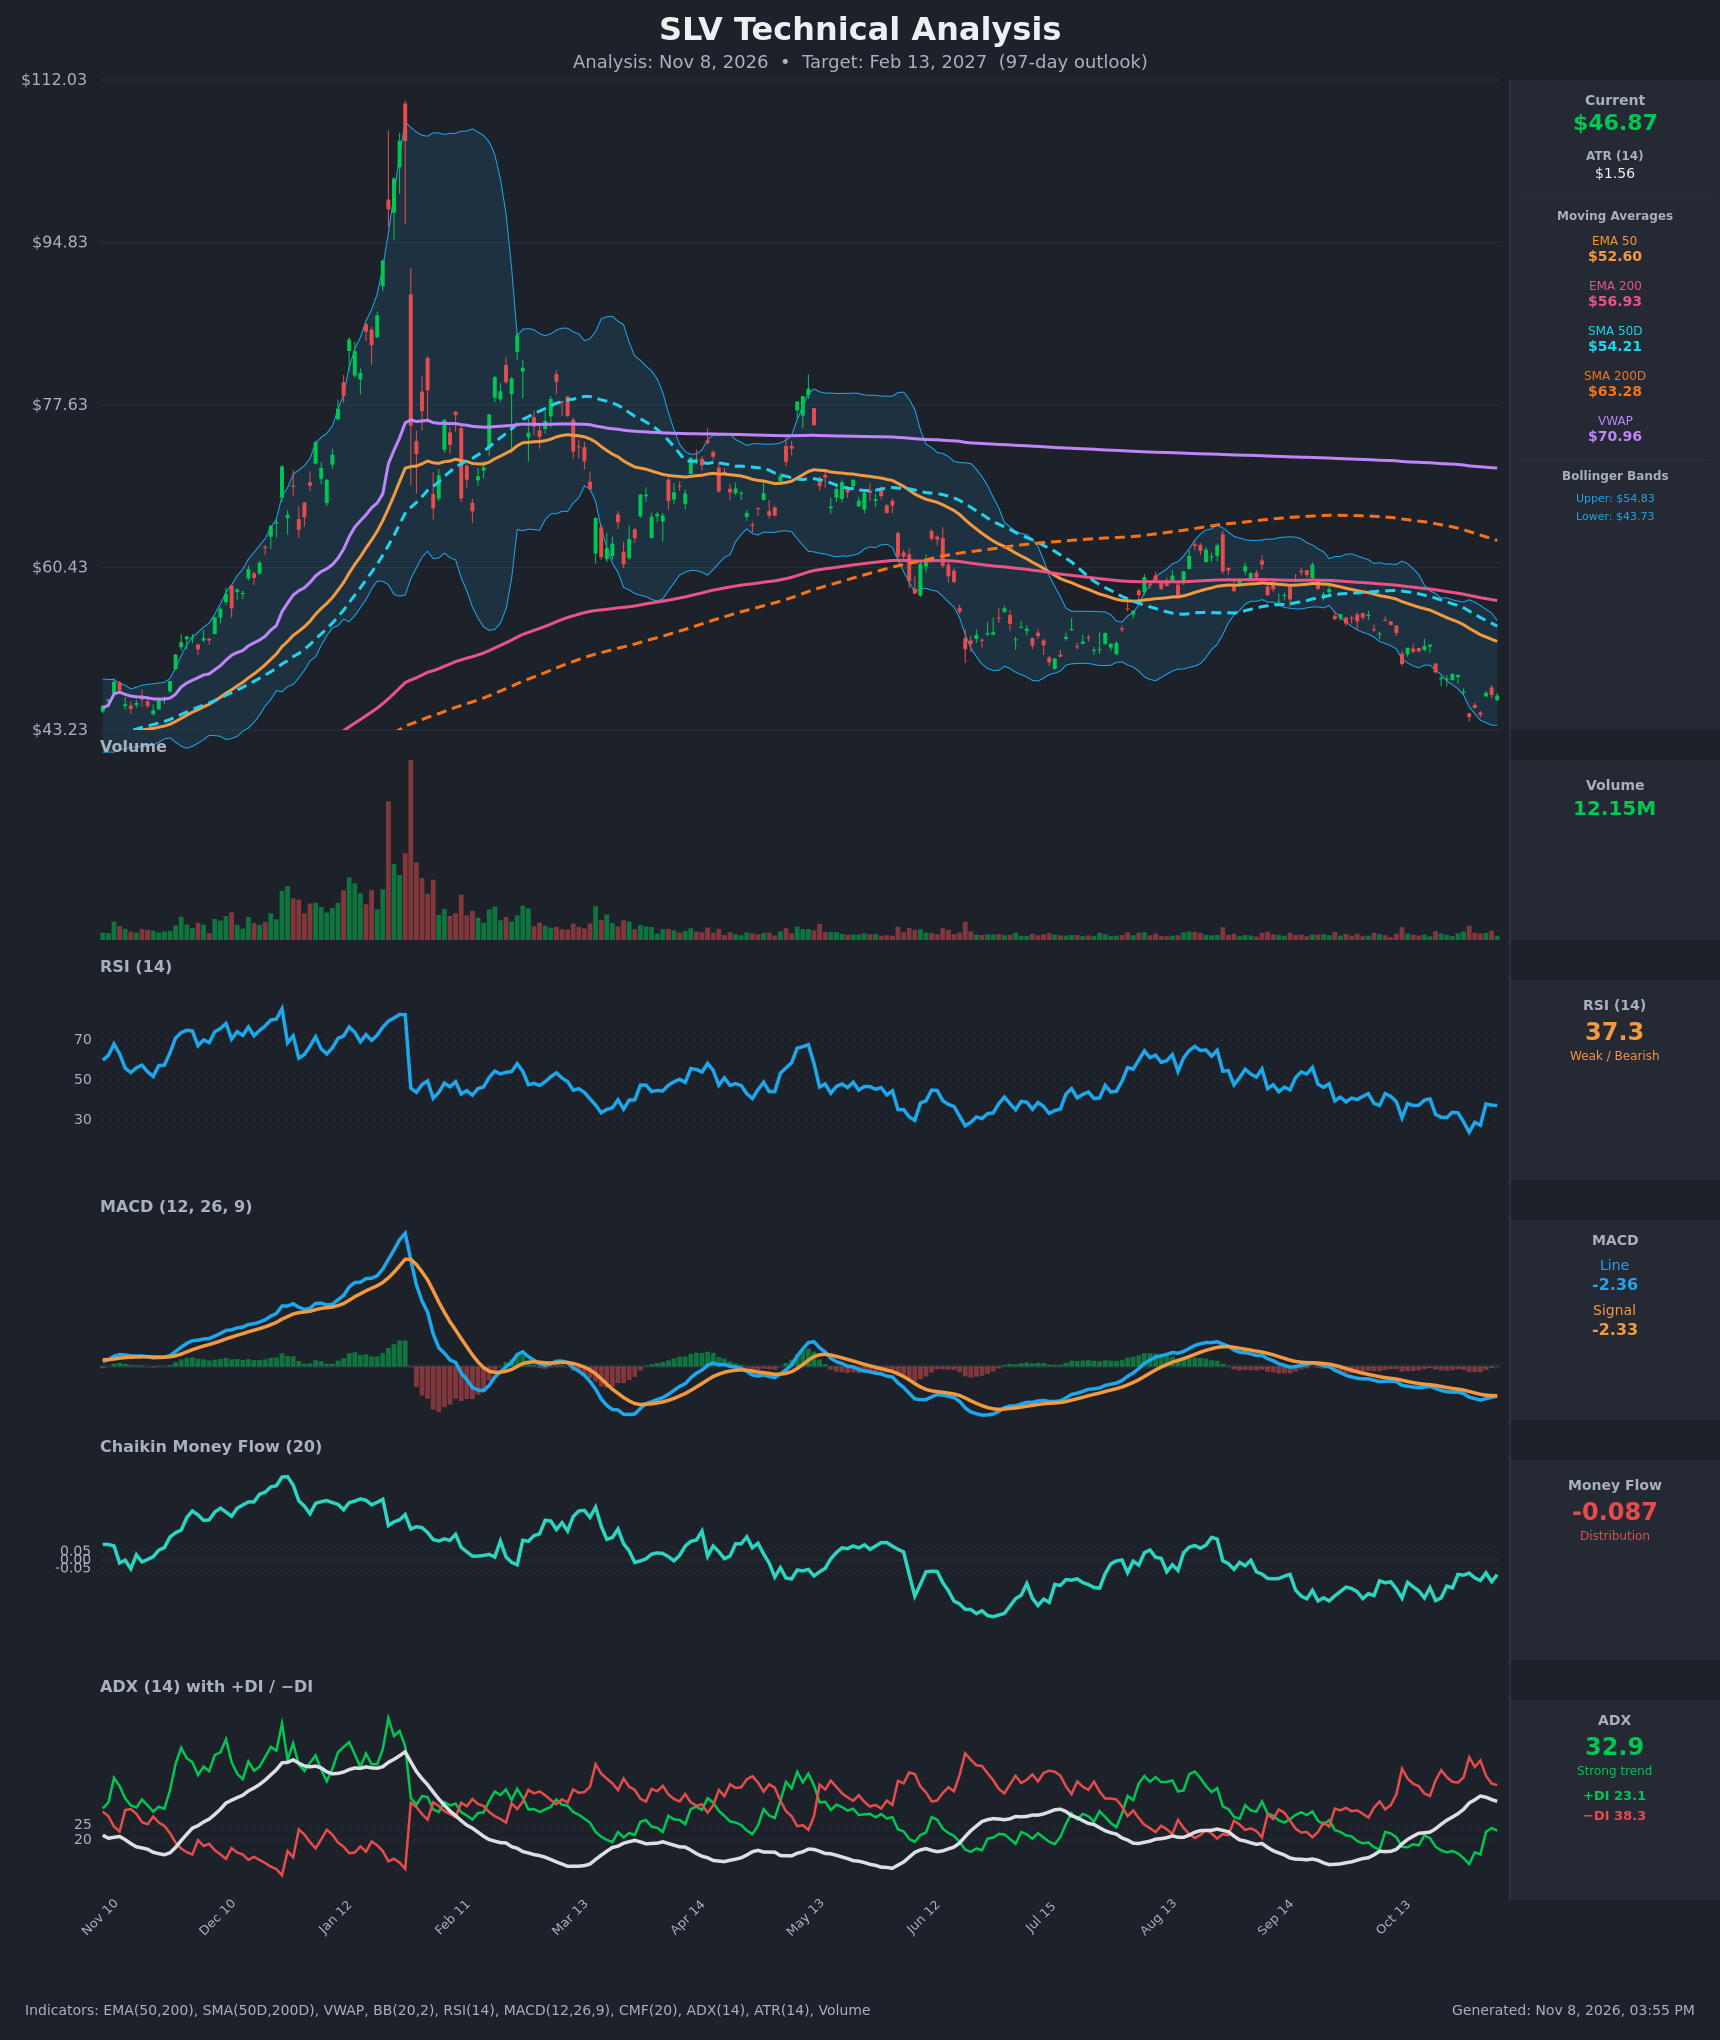
- RSI (14): 37.26. It bounced from a deeply oversold 23.9 on Oct 30 but has stalled in the high 30s, below the 50 midline. It is not yet oversold, so there is room for more downside, but momentum has stopped accelerating lower. [Bearish]
- 20 EMA: The 20 EMA is not supplied. The nearest reference is the EMA 50 at $52.60 (EMA 200 at $56.93), both falling and well above price. Price sits about 11% below the EMA 50, so these averages act as overhead resistance. [Bearish]
- MACD: Line -2.355 versus signal -2.334, so the histogram is slightly negative (about -0.02) and narrowing. The line is still below the signal, but the gap has nearly closed after the Nov 3 low. A bullish crossover is close, but both lines are deeply negative and below zero. [Bearish]
- Bollinger Bands (20): Upper $54.83, lower $43.73, with price at $46.87 in the lower third. Price walked along the lower band during the Oct 30 and Nov 3 lows and has bounced about 7% off the band. The wide band reflects elevated volatility. A "band walk" in a downtrend favors continuation, but a mean-reversion bounce toward the $50 midline is possible. [Bearish]
- CMF (20): -0.087, below the -0.05 threshold and negative for months. This is persistent distribution with no sign of accumulation. [Distribution]
- ADX (14): 32.9, above 25 and rising from about 22 over the last two weeks. −DI (38.3) is well above +DI (23.1), so bears control a strong trend. ADX has eased slightly from its 34.6 peak, which hints at some trend fatigue. [Strong Trend - Bearish]
- Volume: 12.15M, modest and well below the Jan-Feb spike. The recent decline came on steady rather than climactic volume, so there is no capitulation spike that would mark a washout low. [Neutral to mildly Bearish]
DIVERGENCES & TRENDS
- Moving average structure: Price ($46.87) is below the EMA 50 ($52.60), EMA 200 ($56.93), SMA 50D ($54.22), SMA 200D ($63.28) and VWAP ($70.96). EMA 50 is below EMA 200 and SMA 50D is below SMA 200D (a death cross that is already in place), so this is a fully bearish stack.
- Price vs. RSI: The Oct 30 price low at $44.60 had RSI at 23.9, while the Nov 3 retest at $44.84 had RSI at 27.4. This is a minor bullish momentum divergence on the retest, but it is small and so far unconfirmed.
- MACD: The histogram is shrinking toward zero. A cross above the signal line is imminent, which would be a short-term relief signal. It would still occur far below zero, so it would not count as a trend reversal.
- DI lines: −DI dominates +DI by 15 points. +DI has recovered from 12 to 23 but has not crossed. A +DI/−DI crossover would be the first real evidence of a trend shift.
- Trend: Lower highs and lower lows since the Aug 13 peak (~$62), with repeated rejections at the falling EMA 50.
CHART PATTERNS
- Descending channel / bearish continuation: From the ~$62 peak in Aug to the $44.60 low, price has made consistently lower highs and lower lows. This resembles the Bearish Flag/Descending Triangle continuation family. The measured move from the late-Oct breakdown (~$49 to $44.6) projects roughly $42-43 if support at $44.60 fails.
- Possible small Bullish Double Bottom: Lows at $44.60 (Oct 30) and $44.84 (Nov 3) with a bounce high near $47.2. The neckline is around $49.0-49.3, and a confirmed break would project about $53-54. Price has not yet cleared the neckline, so the pattern is unconfirmed and the downtrend takes priority.
- Larger structure: The parabolic spike to ~$110 and the full retracement resemble a Bearish Head and Shoulders / blow-off top that has already played out. Long-term resistance remains stacked overhead.
POTENTIAL SCENARIOS
- Scenario 1: Bearish Trend Continuation — The strong downtrend (ADX 32.9, −DI dominant, persistent distribution) resumes after the relief bounce fades at the $49-$52 resistance zone. Trigger: a daily close below $44.60 on the double-bottom failure. Target: $42.50, with extension to $38-$40. Invalidation: a daily close above $52.60 (EMA 50). (52% probability)
- Scenario 2: Bullish Double-Bottom Relief Rally — The MACD bullish crossover, the RSI divergence and a +DI/−DI cross produce a reversal from the lower Bollinger Band. Trigger: a close above the ~$49.30 neckline on rising volume. Target: $53-$55 (EMA 50 / SMA 50D zone). Invalidation: a close below $44.60. (30% probability)
- Scenario 3: Neutral Basing Range — Price chops between $44 and $50 as volatility compresses and ADX fades below 25. Trigger: failure to break either $44.60 or $49.30. Target: $45-$48. Invalidation: a decisive close outside the $43.70-$50 range. (18% probability)
PRICE TARGETS
- Target Price: $42.50 (97-day horizon, Feb 13, 2027)
- Expected Range: $38.00 to $50.00 (width $12.00, about 25.6% of current price, consistent with the 61-180 day guidance)
- Key Levels: Support at $44.60, Resistance at $49.30
OVERALL BIAS
OVERALL BIAS: BEARISH - Price is below every moving average with −DI dominating a strong ADX trend, MACD still negative, and CMF showing persistent distribution. A relief bounce is plausible given the narrowing MACD histogram and the minor RSI divergence, but the bearish evidence outweighs it unless price reclaims ~$49.30 and then the EMA 50.
This is educational analysis and not financial advice.