IREN 4-day bearish forecast — Nov 15, 2026
- Bias: Bearish
- Timeframe: 4 days (made Nov 15, 2026, target date Nov 18, 2026)
- Price at analysis: $18.16
- Price target: $17.75
- Expected range: $17.30 – $18.30
- Result: Pending — graded after the close on Nov 18, 2026
Get a free AI analysis of IREN today
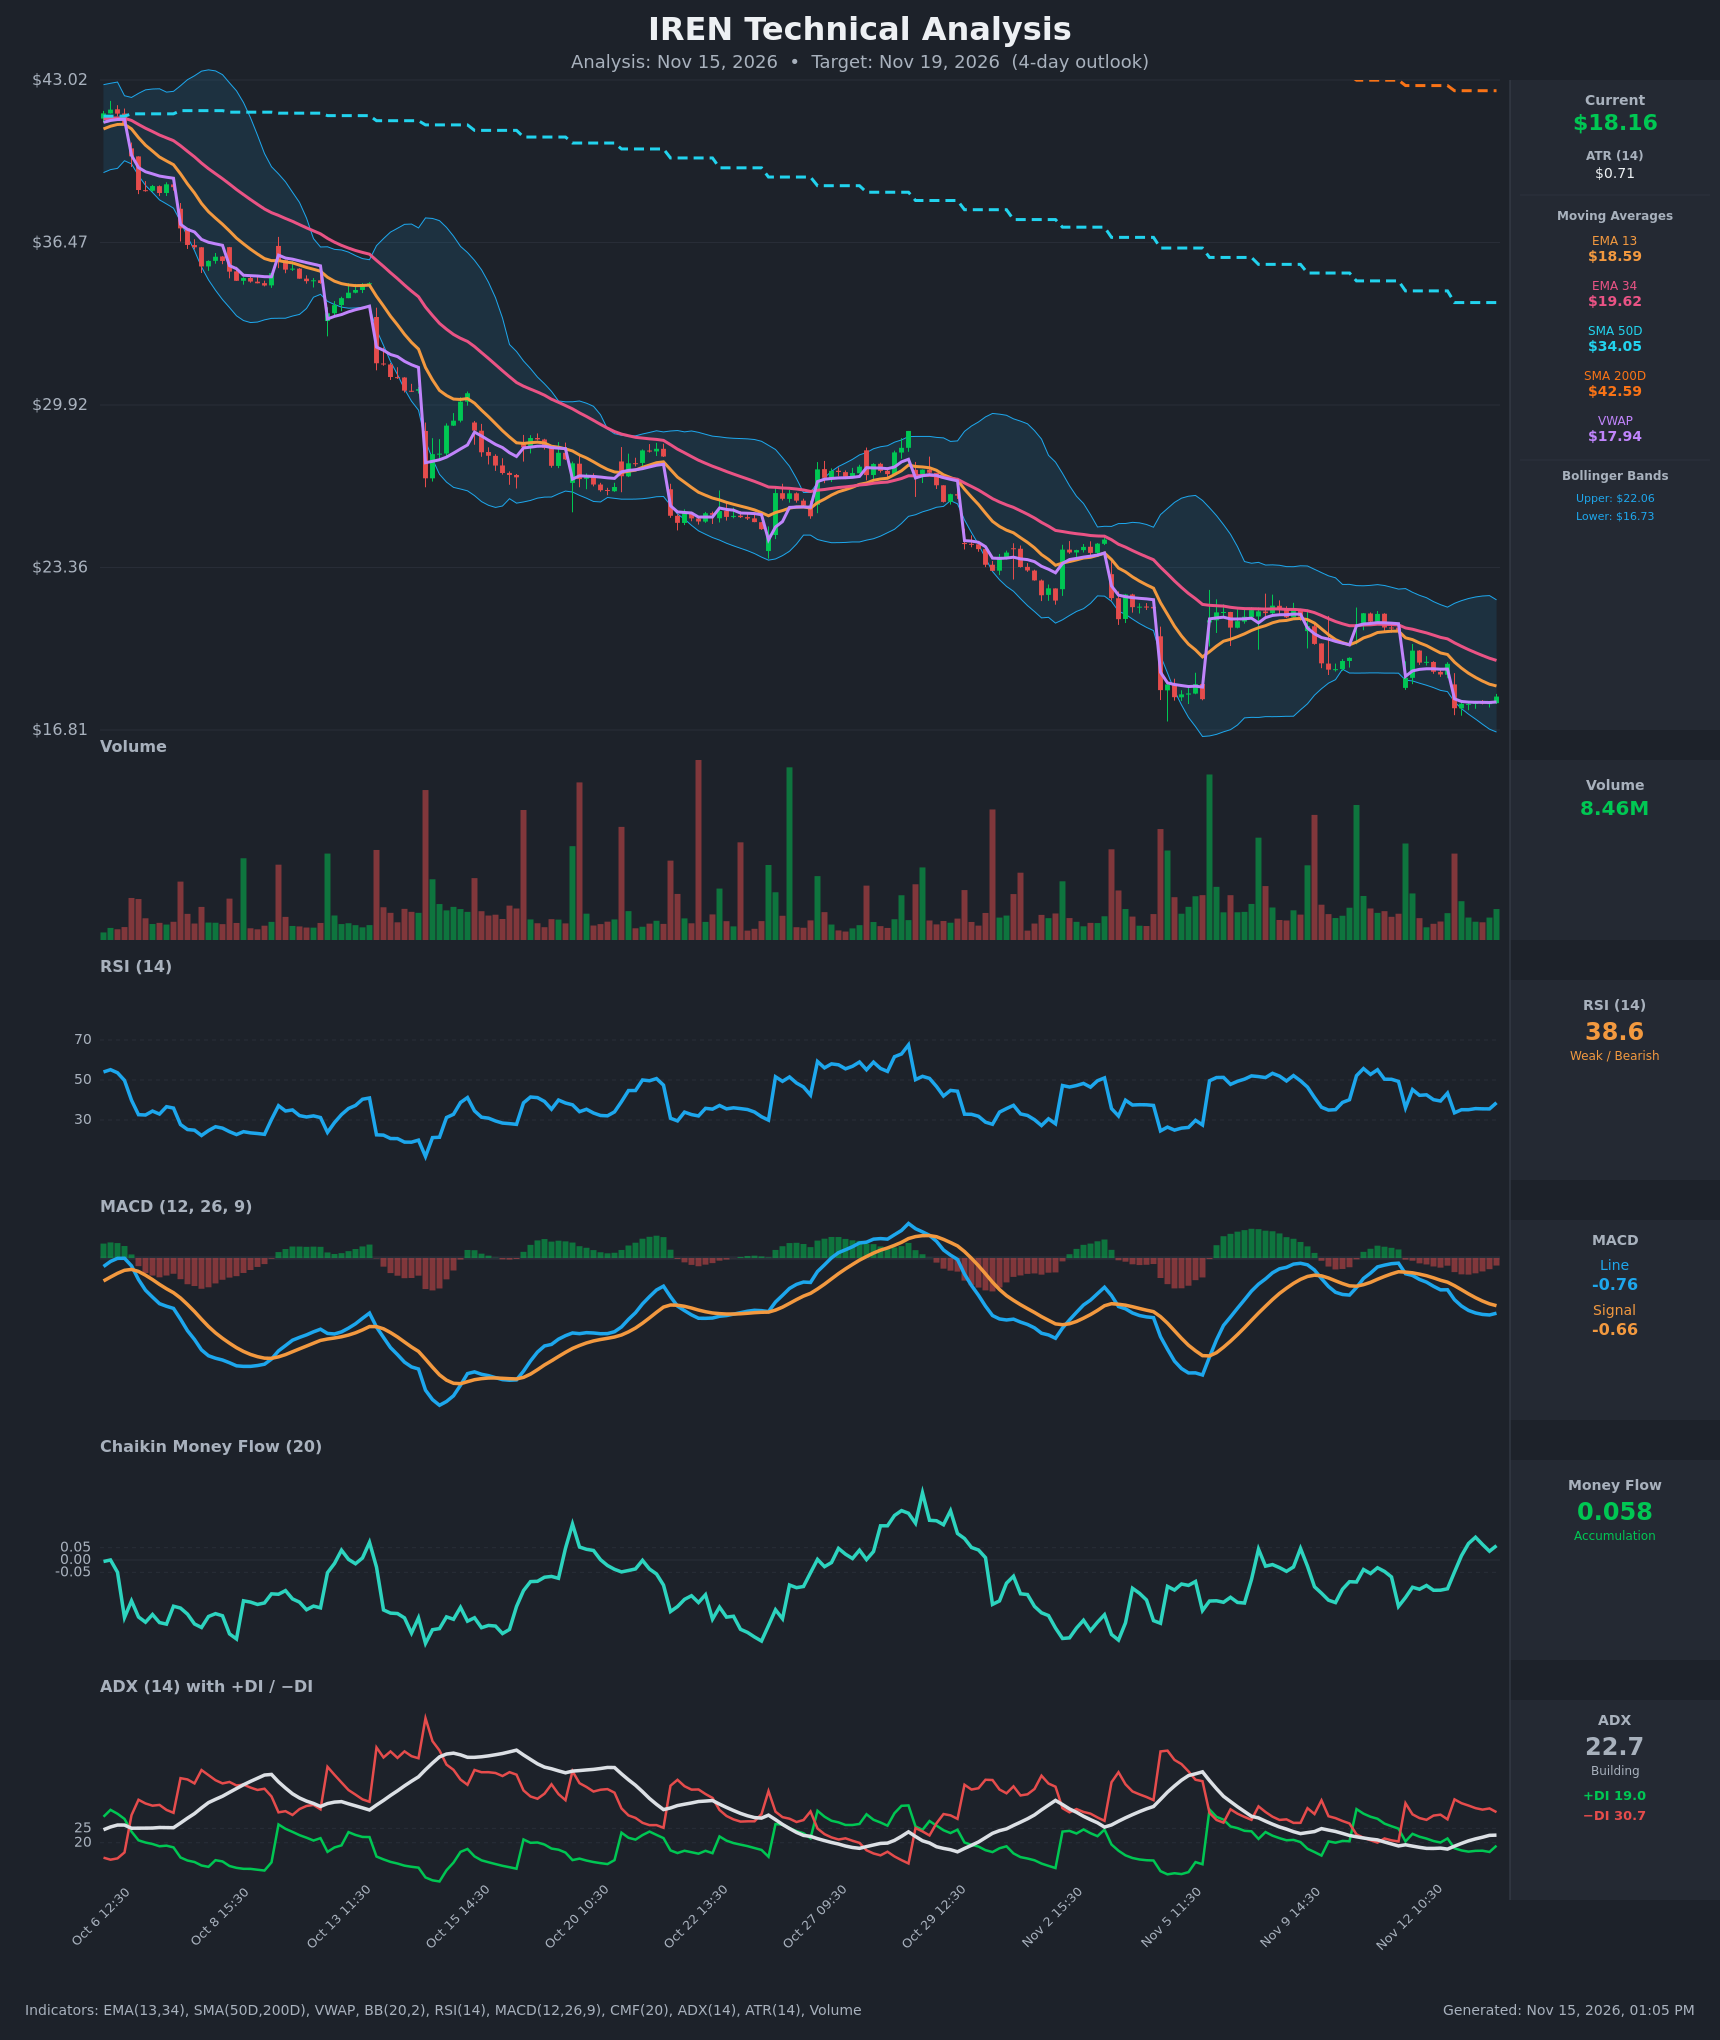
Analysis
TECHNICAL INDICATORS
- RSI (14): 38.64, in the weak zone and above oversold (30). It bounced from 33.6 and 35.5 earlier on Nov 13. It remains below 50 and has been capped under 45–50 on every rally, so momentum is still bearish, though the latest uptick shows selling pressure easing. [Bearish]
- 20 EMA (EMA 13 / EMA 34 used): EMA 13 is $18.59 and EMA 34 is $19.62. Price at $18.16 is below both, and EMA 13 is below EMA 34 and falling steeply. EMA 13 is the first overhead resistance. [Bearish]
- MACD: Line -0.761, signal -0.657, histogram about -0.10. The line has been below the signal since Nov 12 and both are negative. The histogram has narrowed from about -0.15 on the prior bar, so downside momentum is fading slightly, but there is no bullish crossover. [Bearish]
- Bollinger Bands (20): Upper $22.06, lower $16.73, with price in the lower third of the bands (mid-band is roughly $19.40). The bands have been walking lower with the trend. Price is not at the lower band, so there is about $1.40 of room before a band-touch bounce. [Bearish]
- CMF (20): 0.058, just above the +0.05 threshold and up from -0.19 on Nov 11. Money flow has improved, which suggests some dip buying. The reading is marginal and has not been sustained. [Accumulation]
- ADX (14): 22.7 and rising from 17.8, with +DI 19.0 and −DI 30.7. Bears are firmly in control. The trend is still building, close to the 25 threshold. [Moderate, strengthening Downtrend]
- Volume: 8.46M, average to below average on the latest bars, with no capitulation spike. The Nov 12–13 gap-down came on heavy volume, and the bounce since then is on lighter volume, which is typical of a weak relief move. [Neutral to mildly Bearish]
DIVERGENCES & TRENDS
- Trend structure: There is a persistent downtrend from about $42 to $18. Price is far below SMA50D ($34.05) and SMA200D ($42.59). The SMA50D is well below the SMA200D (death cross already in place), and both are still declining.
- EMA stack: EMA 13 has been below EMA 34 since at least Nov 11 and the gap is widening, which is a bearish continuation signal.
- Possible mild bullish divergence: CMF has risen from -0.19 to +0.058 while price made lower lows. RSI also made a higher low at about 35 versus the 33.6 low. This is not yet confirmed by price or MACD.
- DI/ADX: −DI is well above +DI (30.7 vs 19.0) and ADX is rising, so the bearish trend is strengthening.
- VWAP: Price ($18.16) is just above VWAP ($17.94). This is a minor short-term positive, but VWAP resets and is not a trend signal.
- Crossovers: The MACD bearish cross is in force, and no bullish cross has occurred.
CHART PATTERNS
- Bearish continuation structure: Price is in a long, stair-step downtrend with lower highs and lower lows, marked by repeated gap-downs followed by tight consolidations. The tight Nov 13 range around $17.86–$17.92 resembles a Bearish Pennant/Flag Pattern, whose resolution is typically a downside break. The measured move is roughly a repeat of the prior leg's extension, though the nearby lower Bollinger Band at $16.73 limits near-term follow-through.
- Risk to the bearish read: A bounce toward EMA 13 ($18.59) would be consistent with a relief rally inside the downtrend. A close above EMA 34 ($19.62) would be needed to challenge the bearish structure.
- No clean reversal pattern, such as a double bottom or falling wedge, has confirmed.
POTENTIAL SCENARIOS
- Scenario 1: Bearish Trend Continuation — The relief bounce stalls at EMA 13/VWAP, and sellers push price back below the Nov 13 low. Trigger: failure at $18.59 or a break below $17.69. Target: $17.30–$17.75, with an extension toward the lower band at $16.73. Invalidation: a close above $19.00. (52% probability)
- Scenario 2: Bullish Relief Bounce — CMF accumulation and a narrowing MACD histogram support a short-covering bounce toward the declining EMAs. Trigger: a break above $18.59 on rising volume. Target: $19.20–$19.60 (EMA 34 area). Invalidation: a drop below $17.69. (28% probability)
- Scenario 3: Neutral Consolidation — Price chops between VWAP and EMA 13 with no ADX follow-through. Trigger: no decisive break of $17.69 or $18.59. Target: $17.90–$18.40. Invalidation: a close beyond either boundary. (20% probability)
PRICE TARGETS
Range check for a 4-day timeframe (between the 2–3 day band of 2–4% and the 7–10 day band of 4–8%): $18.30 − $17.30 = $1.00, which is about 5.5% of the $18.16 current price. This fits the 4-day scaling and is about 1.4x ATR.
- Target Price: $17.75 (4 days out)
- Expected Range: $17.30 to $18.30
- Key Levels: Support at $17.69, Resistance at $18.59
OVERALL BIAS
OVERALL BIAS: BEARISH - Price is below all key moving averages, −DI (30.7) is dominating +DI (19.0) with ADX rising, and MACD is below its signal line. Improving CMF and a narrowing MACD histogram suggest a possible relief bounce, but it is more likely to fail near EMA 13 ($18.59) within the larger downtrend.
This is educational analysis and not financial advice.