IREN 6-day bearish forecast — Nov 15, 2026
- Bias: Bearish
- Timeframe: 6 days (made Nov 15, 2026, target date Nov 20, 2026)
- Price at analysis: $18.16
- Price target: $17.60
- Expected range: $16.95 – $18.35
- Result: Pending — graded after the close on Nov 20, 2026
Get a free AI analysis of IREN today
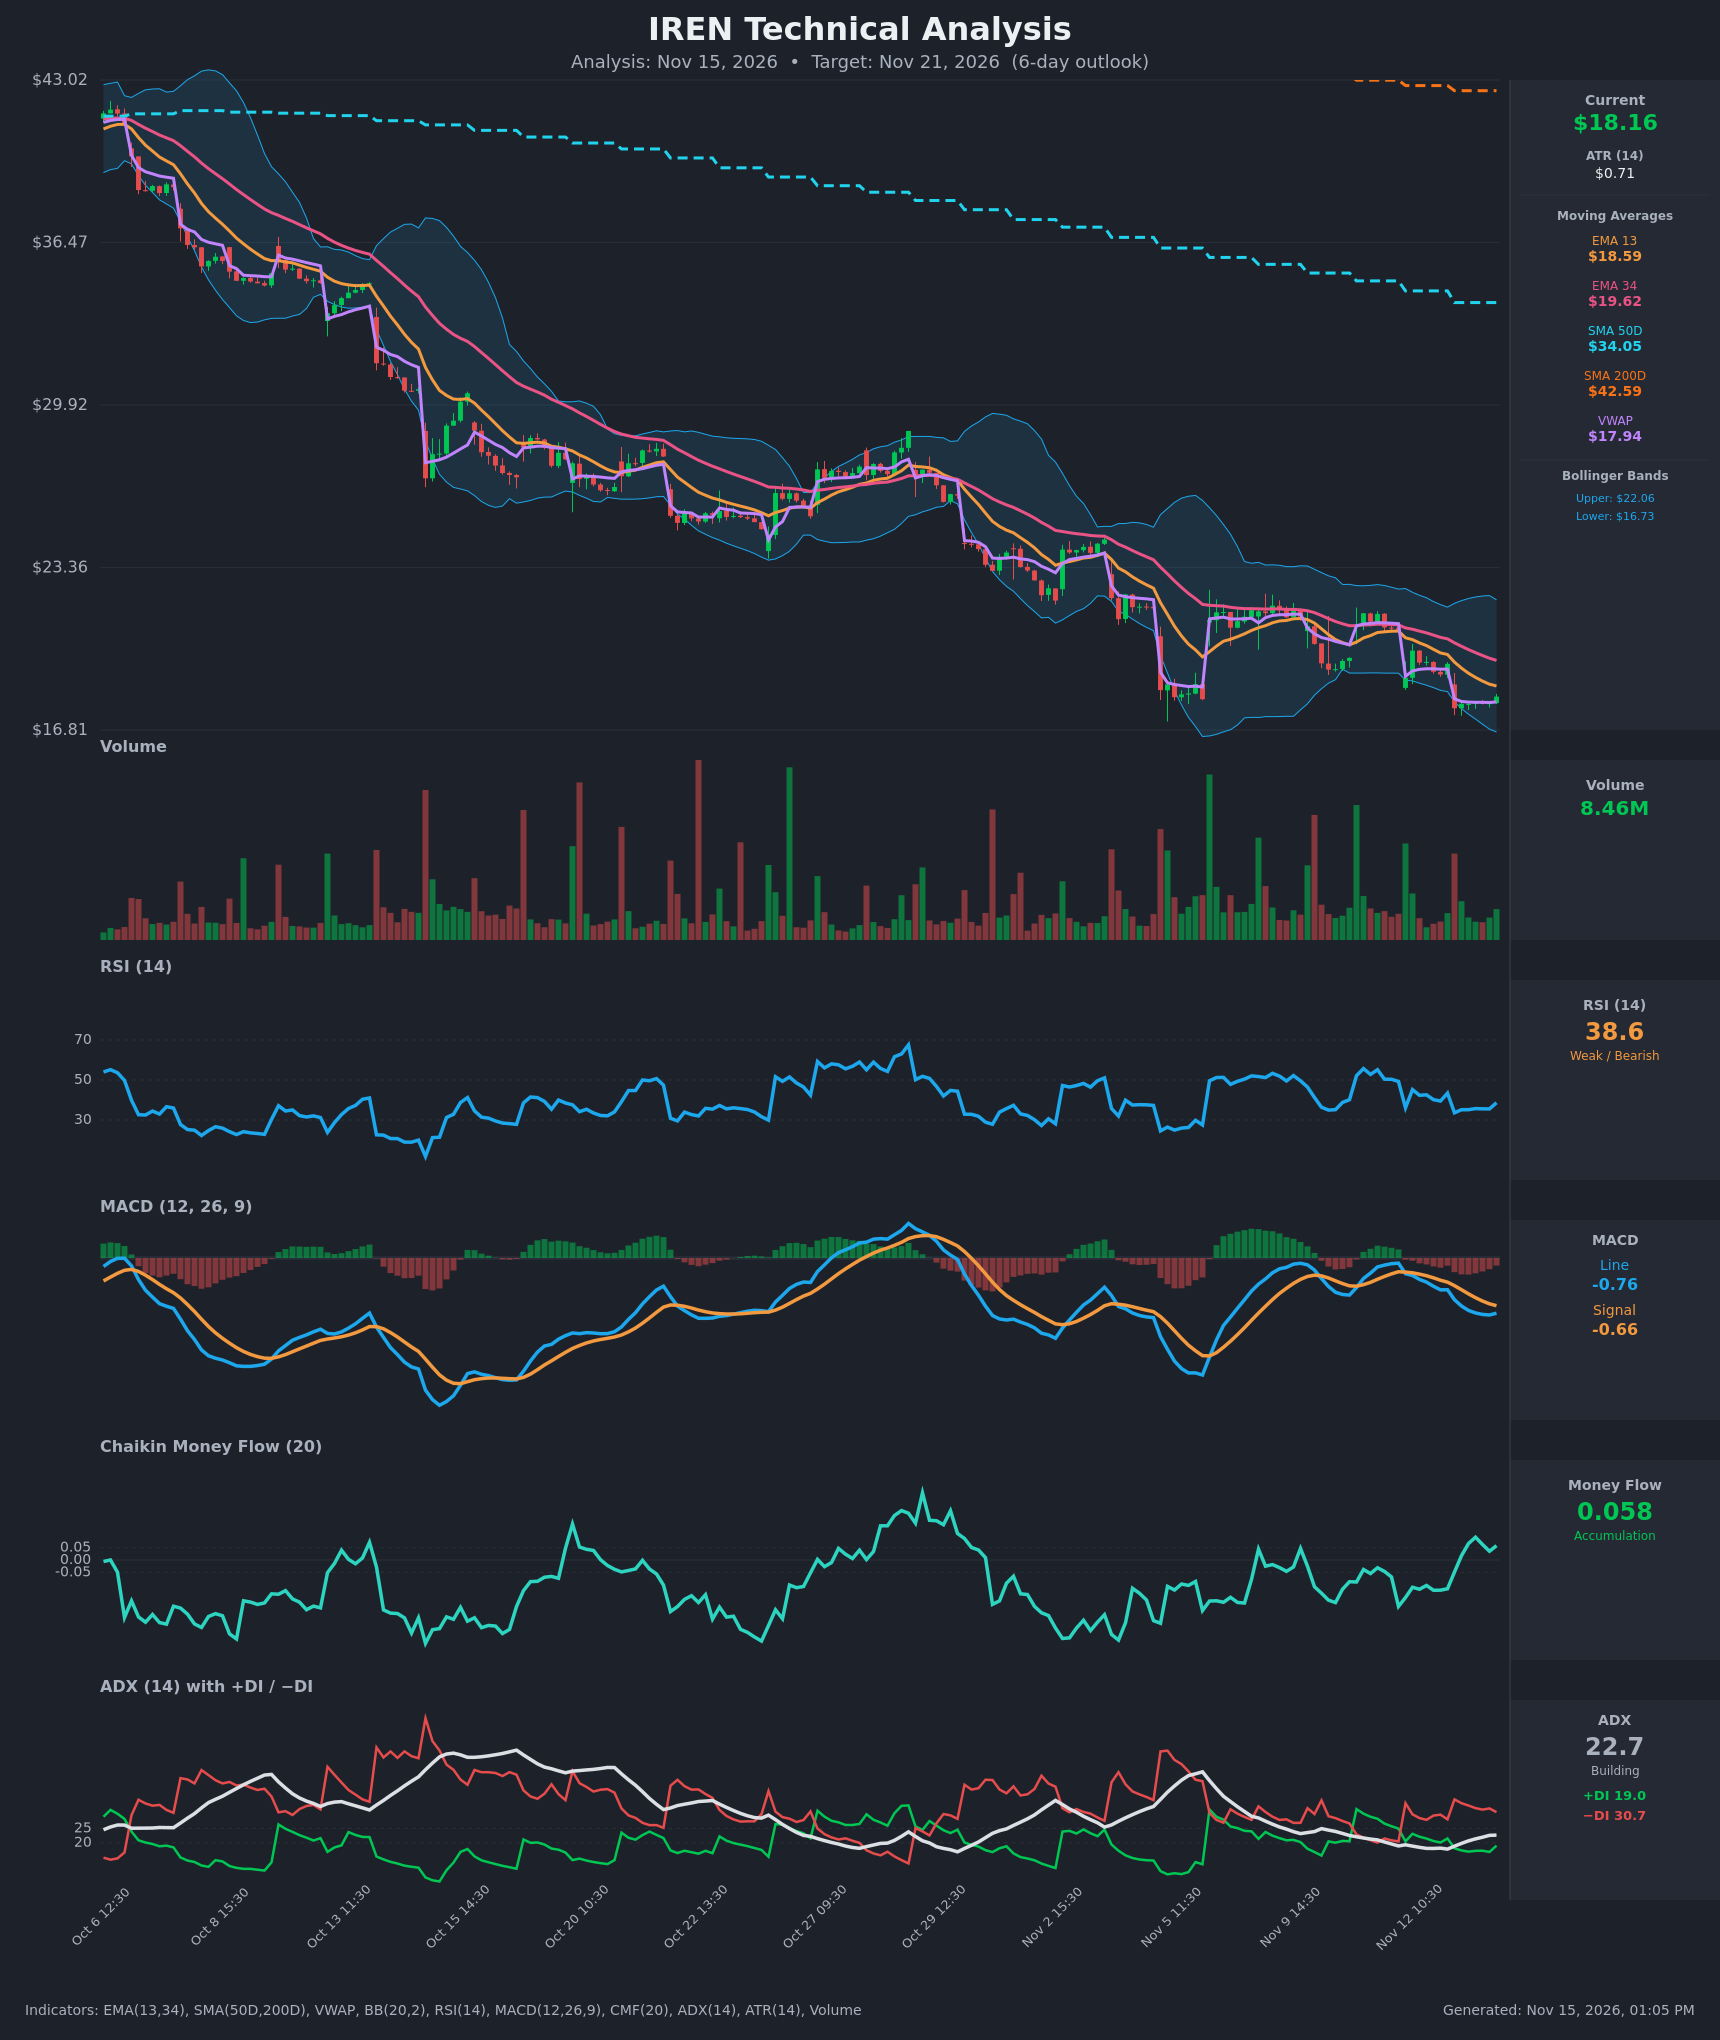
Analysis
TECHNICAL INDICATORS
- RSI (14): 38.64, in the weak zone but not oversold. It bounced from 33.6 on Nov 13 and has stayed in the 33-39 range, so momentum is subdued and bearish-leaning. It has not made a higher high. [Bearish]
- 20 EMA: The supplied values are EMA 13 at $18.59 and EMA 34 at $19.62. Price ($18.16) is below both, and EMA13 is below EMA34, so both act as overhead resistance. The EMA13/34 gap has widened from about $0.25 on Nov 11 to about $1.03 now. [Bearish]
- MACD: The line is -0.76 and the signal is -0.66, so the line is below the signal with a negative histogram (about -0.10). The bearish crossover happened on Nov 12 and the gap has widened since. The latest bar ticked up slightly (-0.785 to -0.761), which hints at the histogram flattening, but there is no bullish cross yet. [Bearish]
- Bollinger Bands (20): Upper $22.06, lower $16.73, so price sits in the lower quarter of the bands, about $1.43 above the lower band. The bands are wide and sloping down, which fits a persistent downtrend. A touch of the lower band is possible, but it is more often a "walk the band" signal than a reversal in this kind of trend. [Bearish]
- CMF (20): 0.058, just above the +0.05 accumulation threshold. It rose from -0.19 on Nov 11 to slightly positive, so selling pressure has eased. The reading is marginal, and it has not been sustained or confirmed by price. [Neutral]
- ADX (14): 22.7 and rising from about 18, with −DI (30.7) well above +DI (19.0). The trend is gaining strength and the bears are in control. ADX is just below the 25 "strong" threshold. [Moderate Trend, Bearish]
- Volume: 8.46M, below the spikes of the prior sell-offs and relatively light on the latest bounce. The last gap-down bars had heavy volume, while the sideways base near $17.9 has faded volume. This looks like consolidation rather than aggressive accumulation. [Neutral-to-Bearish]
DIVERGENCES & TRENDS
- Long-term trend: Price is far below SMA50D ($34.05) and SMA200D ($42.59). SMA50 is below SMA200 (a death cross), and both are falling. The price is in a powerful, persistent long-term downtrend with lower highs and lower lows from $43 to $18.
- EMA structure: EMA13 < EMA34 < SMA50 < SMA200 is a fully bearish stack, and the gaps between the averages are widening.
- Mild divergence: CMF has recovered to +0.058 while price made a new low near $17.7-17.9, and RSI is holding the 33-35 area. This is a minor positive divergence that could support a relief bounce, but it is not confirmed by MACD or by volume.
- MACD: The bearish crossover on Nov 12 remains in force, and the line is still below zero.
- VWAP: Price ($18.16) is just above VWAP ($17.94). This is a small short-term positive, but VWAP has been dragging lower in step with price.
- DI: −DI has been above +DI since Nov 12. The only bullish DI flip came on Nov 11 and failed.
CHART PATTERNS
- Bearish Pennant / Bearish Flag (continuation): After the gap-down to about $17.7, price has formed a tight sideways base at $17.85-$18.16. This resembles a bearish flag or pennant within a larger descending channel. A breakdown targets the flagpole measure, and the nearest swing target is the lower Bollinger Band at about $16.73.
- Larger structure: A persistent stair-step downtrend with lower highs at each failed rally (about $21.5-22 in early November). It resembles a descending channel, which is bearish continuation.
- Invalidation of the pattern: A close back above EMA13 ($18.59) and then EMA34 ($19.62) would negate the flag and imply a relief rally.
POTENTIAL SCENARIOS
- Scenario 1: Bearish Continuation Breakdown — The sideways base resolves lower, with −DI dominating and MACD staying below its signal. Trigger: hourly close below $17.65. Target: $17.00-$17.60, with the lower Bollinger Band at $16.73 as an extension. Invalidation: close above $18.60 (EMA13). (55% probability)
- Scenario 2: Bullish Relief Bounce — CMF accumulation and the RSI base near 33-35 drive a short-term rally in an oversold, extended market. Trigger: break above $18.59 on rising volume and a MACD histogram flip. Target: $19.60 (EMA34). Invalidation: loss of $17.65. (28% probability)
- Scenario 3: Neutral Range Consolidation — Price chops between $17.65 and $18.60 with fading volume as ADX stays near 22. Trigger: failure to break either boundary. Target: $17.90-$18.30. Invalidation: a decisive close outside the $17.65-$18.60 range. (17% probability)
PRICE TARGETS
- Target Price: $17.60 (6-day horizon)
- Expected Range: $16.95 to $18.35. Width is $1.40, about 7.7% of the current price, which is consistent with the 6-day timeframe.
- Key Levels: Support at $17.65 (recent swing low area, with $16.73 lower Bollinger Band below it), Resistance at $18.59 (EMA13, with EMA34 at $19.62 above it)
OVERALL BIAS
OVERALL BIAS: BEARISH - Price is below the full bearish MA stack with a death cross, MACD is below its signal, and −DI dominates a rising ADX. The tight base near $17.9 looks like a bearish flag, while the marginal CMF improvement only argues for a possible short-lived bounce.
This is educational analysis and not financial advice.