MARA 4-day bearish forecast — Nov 15, 2026
- Bias: Bearish
- Timeframe: 4 days (made Nov 15, 2026, target date Nov 18, 2026)
- Price at analysis: $6.99
- Price target: $6.80
- Expected range: $6.45 – $7.25
- Result: Pending — graded after the close on Nov 18, 2026
Get a free AI analysis of MARA today
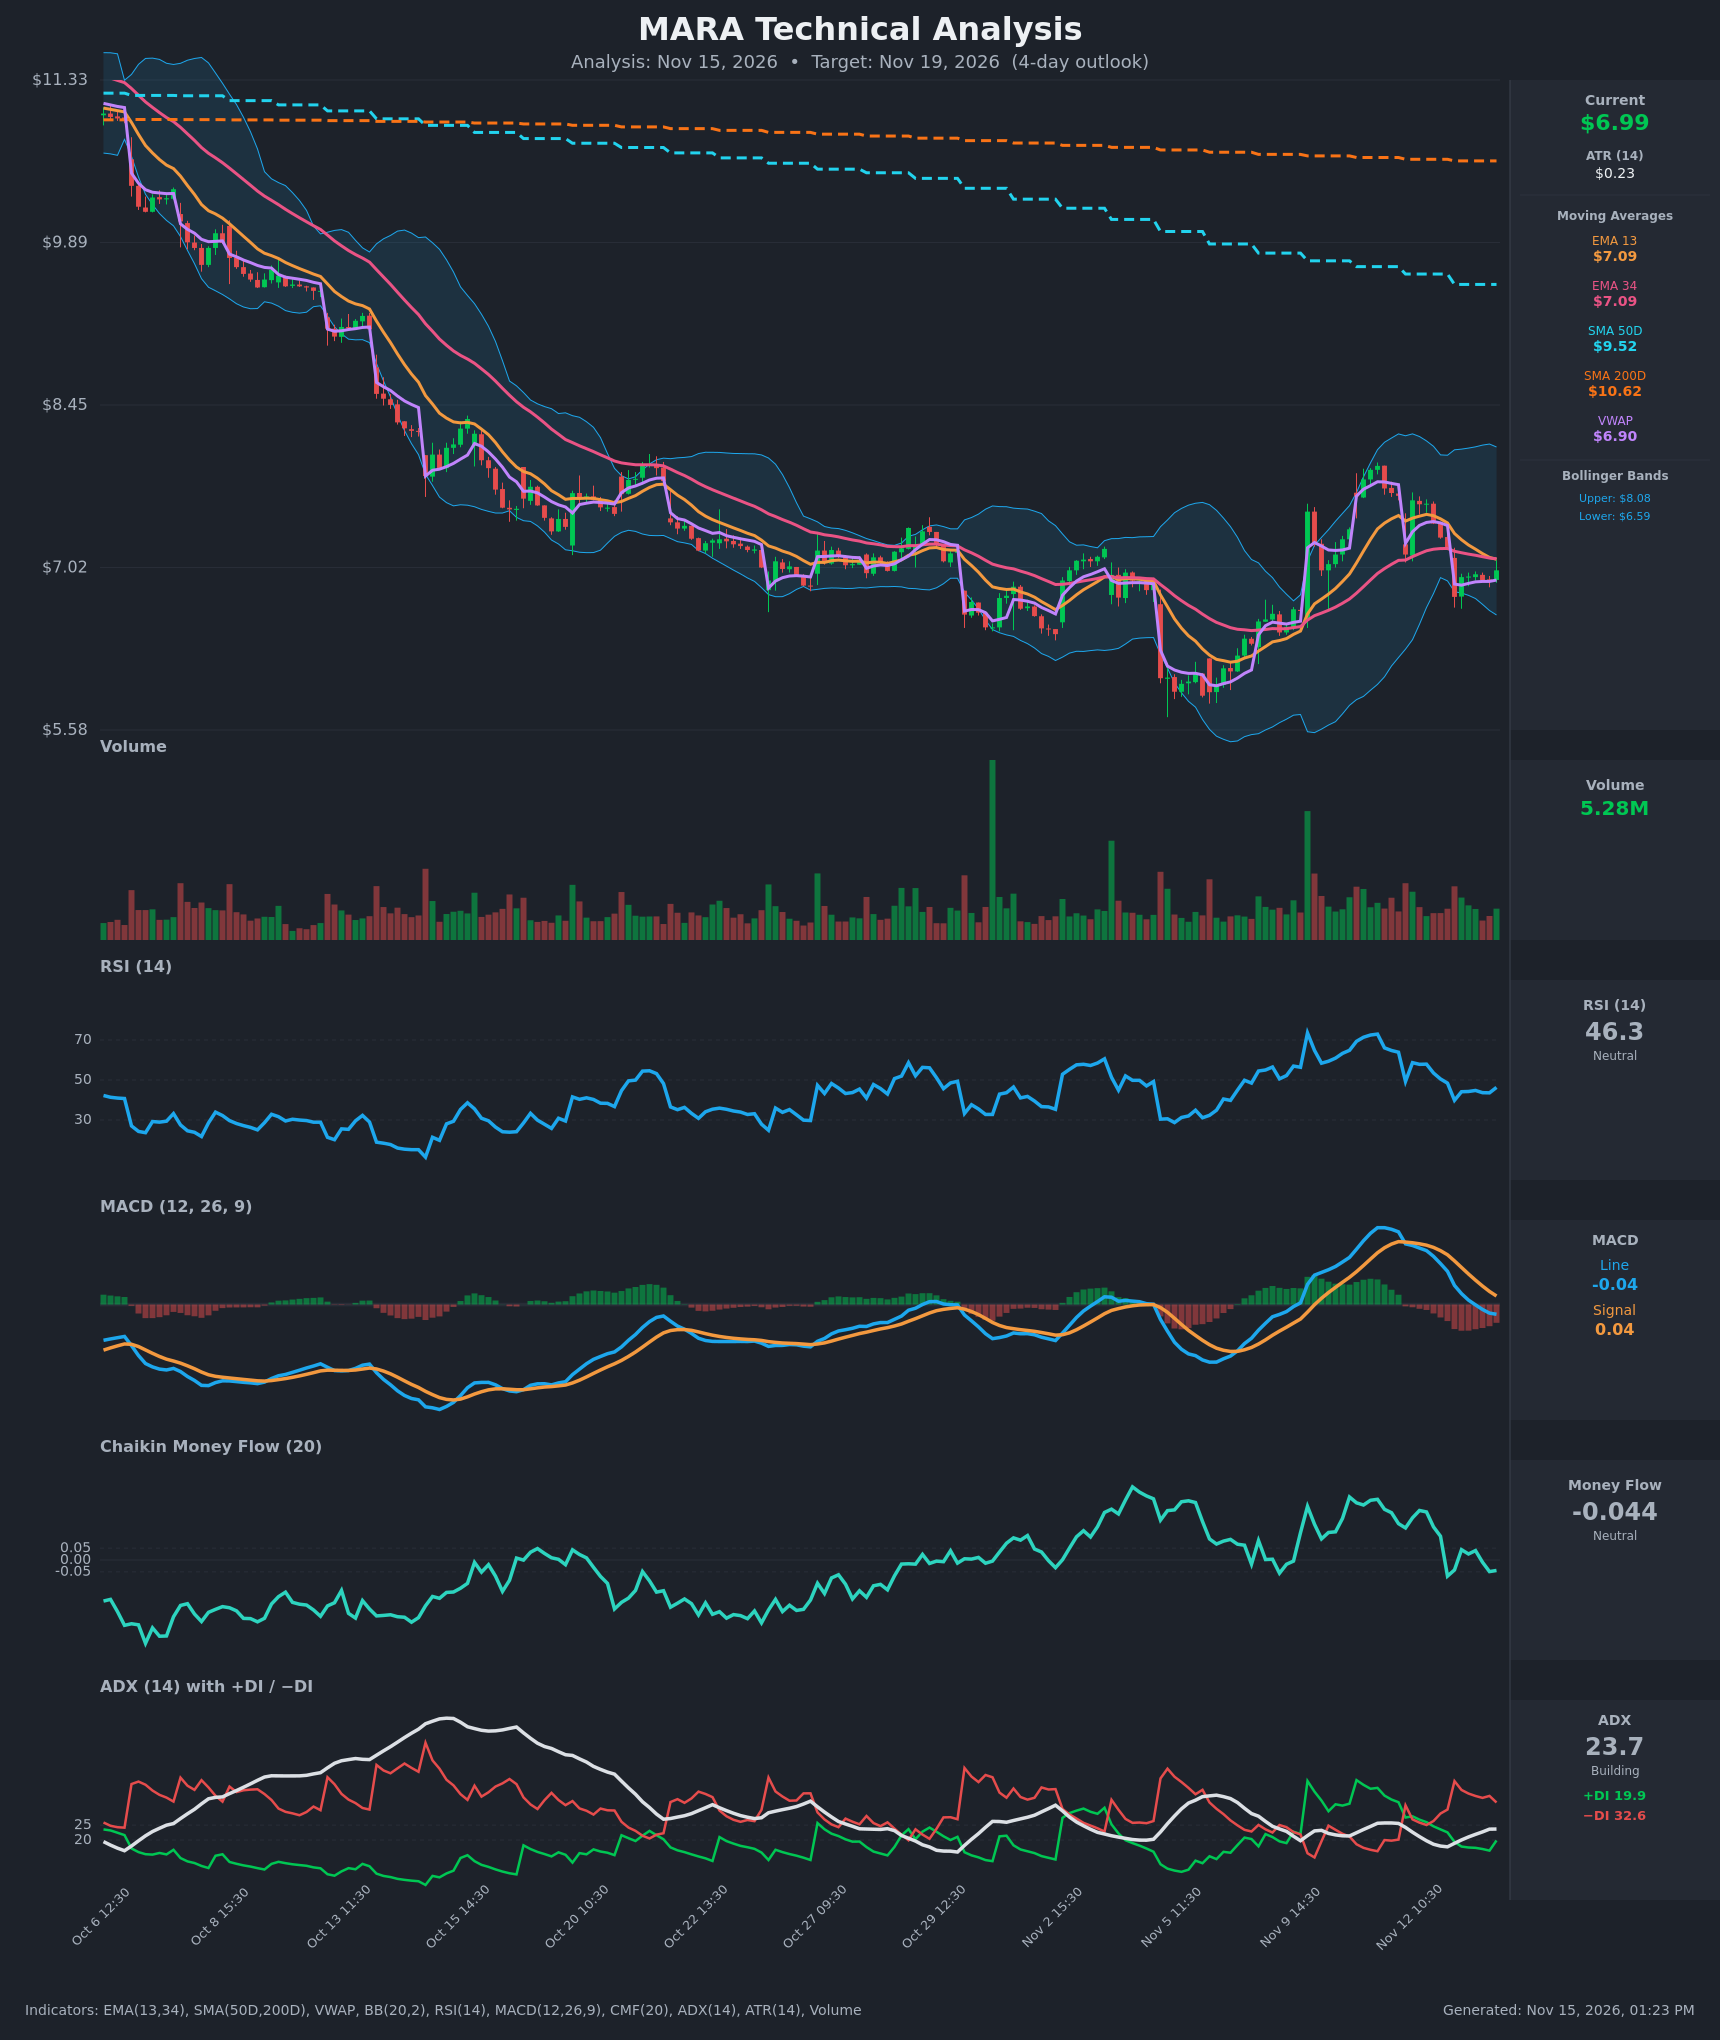
Analysis
TECHNICAL INDICATORS
- RSI (14): 46.30, sitting just under the 50 midline. It has fallen from about 72 in early November and bounced slightly from 39.8. Momentum is soft but not oversold. [Neutral]
- 20 EMA: The chart uses EMA 13 ($7.0881) and EMA 34 ($7.0928), so the 13/34 pair stands in here. Price at $6.99 is below both, and the EMA13 just crossed below the EMA34 (bearish cross). Both are now overhead resistance around $7.09. [Bearish]
- MACD: The line (-0.044) crossed below the signal (0.038) and is now below zero. The histogram is negative and widening, after a peak around Nov 9-10. Momentum is turning down. [Bearish]
- Bollinger Bands (20): Upper $8.08, lower $6.59, with a midline near $7.34. Price is in the lower half of the bands, about $0.40 above the lower band. The bands are fairly wide after the early-November rally, so there is room for a drift toward the lower band. [Bearish]
- CMF (20): -0.044, between the ±0.05 thresholds. It has dropped from clearly positive readings (+0.15 to +0.21) and is near zero, so buying pressure has faded. It is close to distribution. [Neutral]
- ADX (14): 23.7 and rising, with -DI (32.6) well above +DI (19.9). Bears are in control and trend strength is building toward the 25 threshold. [Moderate Trend, Bearish]
- Volume: 5.28M, average to slightly below average. Red bars were heavier during the Nov 12-13 selloff, and the bounce is on light volume. That suggests weak buying conviction. [Mildly Bearish]
DIVERGENCES & TRENDS
- Long-term trend: Price is far below SMA50D ($9.52) and SMA200D ($10.62). SMA50D is well below SMA200D, so the death cross is long established and the primary trend is down.
- Rally failure: The bounce from about $5.80 to about $7.90 failed. Price has retraced most of it and is back at the EMA13/34 cluster.
- Divergences: No clear bullish divergence. RSI, MACD and CMF are all rolling over together, which confirms the price weakness.
- Crossovers: The EMA13 has crossed below the EMA34, and the MACD has crossed below its signal line. -DI is dominant. All three are bearish.
- VWAP: Price is slightly above VWAP ($6.90). This is the one supportive factor, and it is a minor one.
CHART PATTERNS
- Bearish Rising Wedge / Head and Shoulders-type rollover (loose fit): Price made a lower high near $7.90 after the Nov 9 peak and is now rolling over, which fits a failed-rally reversal back into the prior range.
- Prior range: Price is returning to the $6.50-$7.10 base from late October.
- Pattern significance: Support near $6.59 (lower Bollinger Band) and below that the Nov 6 low of about $5.80. A break below $6.59 opens a move toward $6.40-$6.50.
- Resistance: The EMA13/34 cluster at $7.09, then $7.40.
POTENTIAL SCENARIOS
- Scenario 1: Bearish Continuation Lower — Price is rejected at the $7.09 EMA cluster, the MACD stays negative, and -DI stays dominant, so price drifts toward the lower Bollinger Band. Trigger: a break below $6.90 (VWAP) and then $6.75. Target: $6.60-$6.75. Invalidation: a close above $7.25. (55% probability)
- Scenario 2: Neutral Range Chop — Price consolidates between $6.75 and $7.15 as ADX stays near 24 and RSI stays near 45-50. Trigger: price holds above VWAP and the Nov 13 low. Target: $6.90-$7.05. Invalidation: a break outside $6.60-$7.30. (25% probability)
- Scenario 3: Bullish Bounce — Price recovers the EMA cluster and squeezes toward the mid-band. Trigger: a close above $7.10 on rising volume. Target: $7.35-$7.50. Invalidation: a fall back below $6.90. (20% probability)
PRICE TARGETS
- Target Price: $6.80 (4-day timeframe)
- Expected Range: $6.45 to $7.25 (width $0.80, about 11.4% of the current price). That is wider than the roughly 4-7% typically seen at this horizon, but it is justified by MARA's volatility (ATR $0.23, about 3.2% of price per day).
- Key Levels: Support at $6.59, Resistance at $7.09
OVERALL BIAS
OVERALL BIAS: BEARISH - The EMA13 has crossed below the EMA34, the MACD has crossed below its signal line, -DI (32.6) is far above +DI (19.9), and price is far below the 50-day and 200-day SMAs. The bounce is on light volume and faces overhead resistance at $7.09.
This is educational analysis and not financial advice.