NIO 6-day bearish forecast — Nov 15, 2026
- Bias: Bearish
- Timeframe: 6 days (made Nov 15, 2026, target date Nov 20, 2026)
- Price at analysis: $2.89
- Price target: $2.80
- Expected range: $2.70 – $2.93
- Result: Pending — graded after the close on Nov 20, 2026
Get a free AI analysis of NIO today
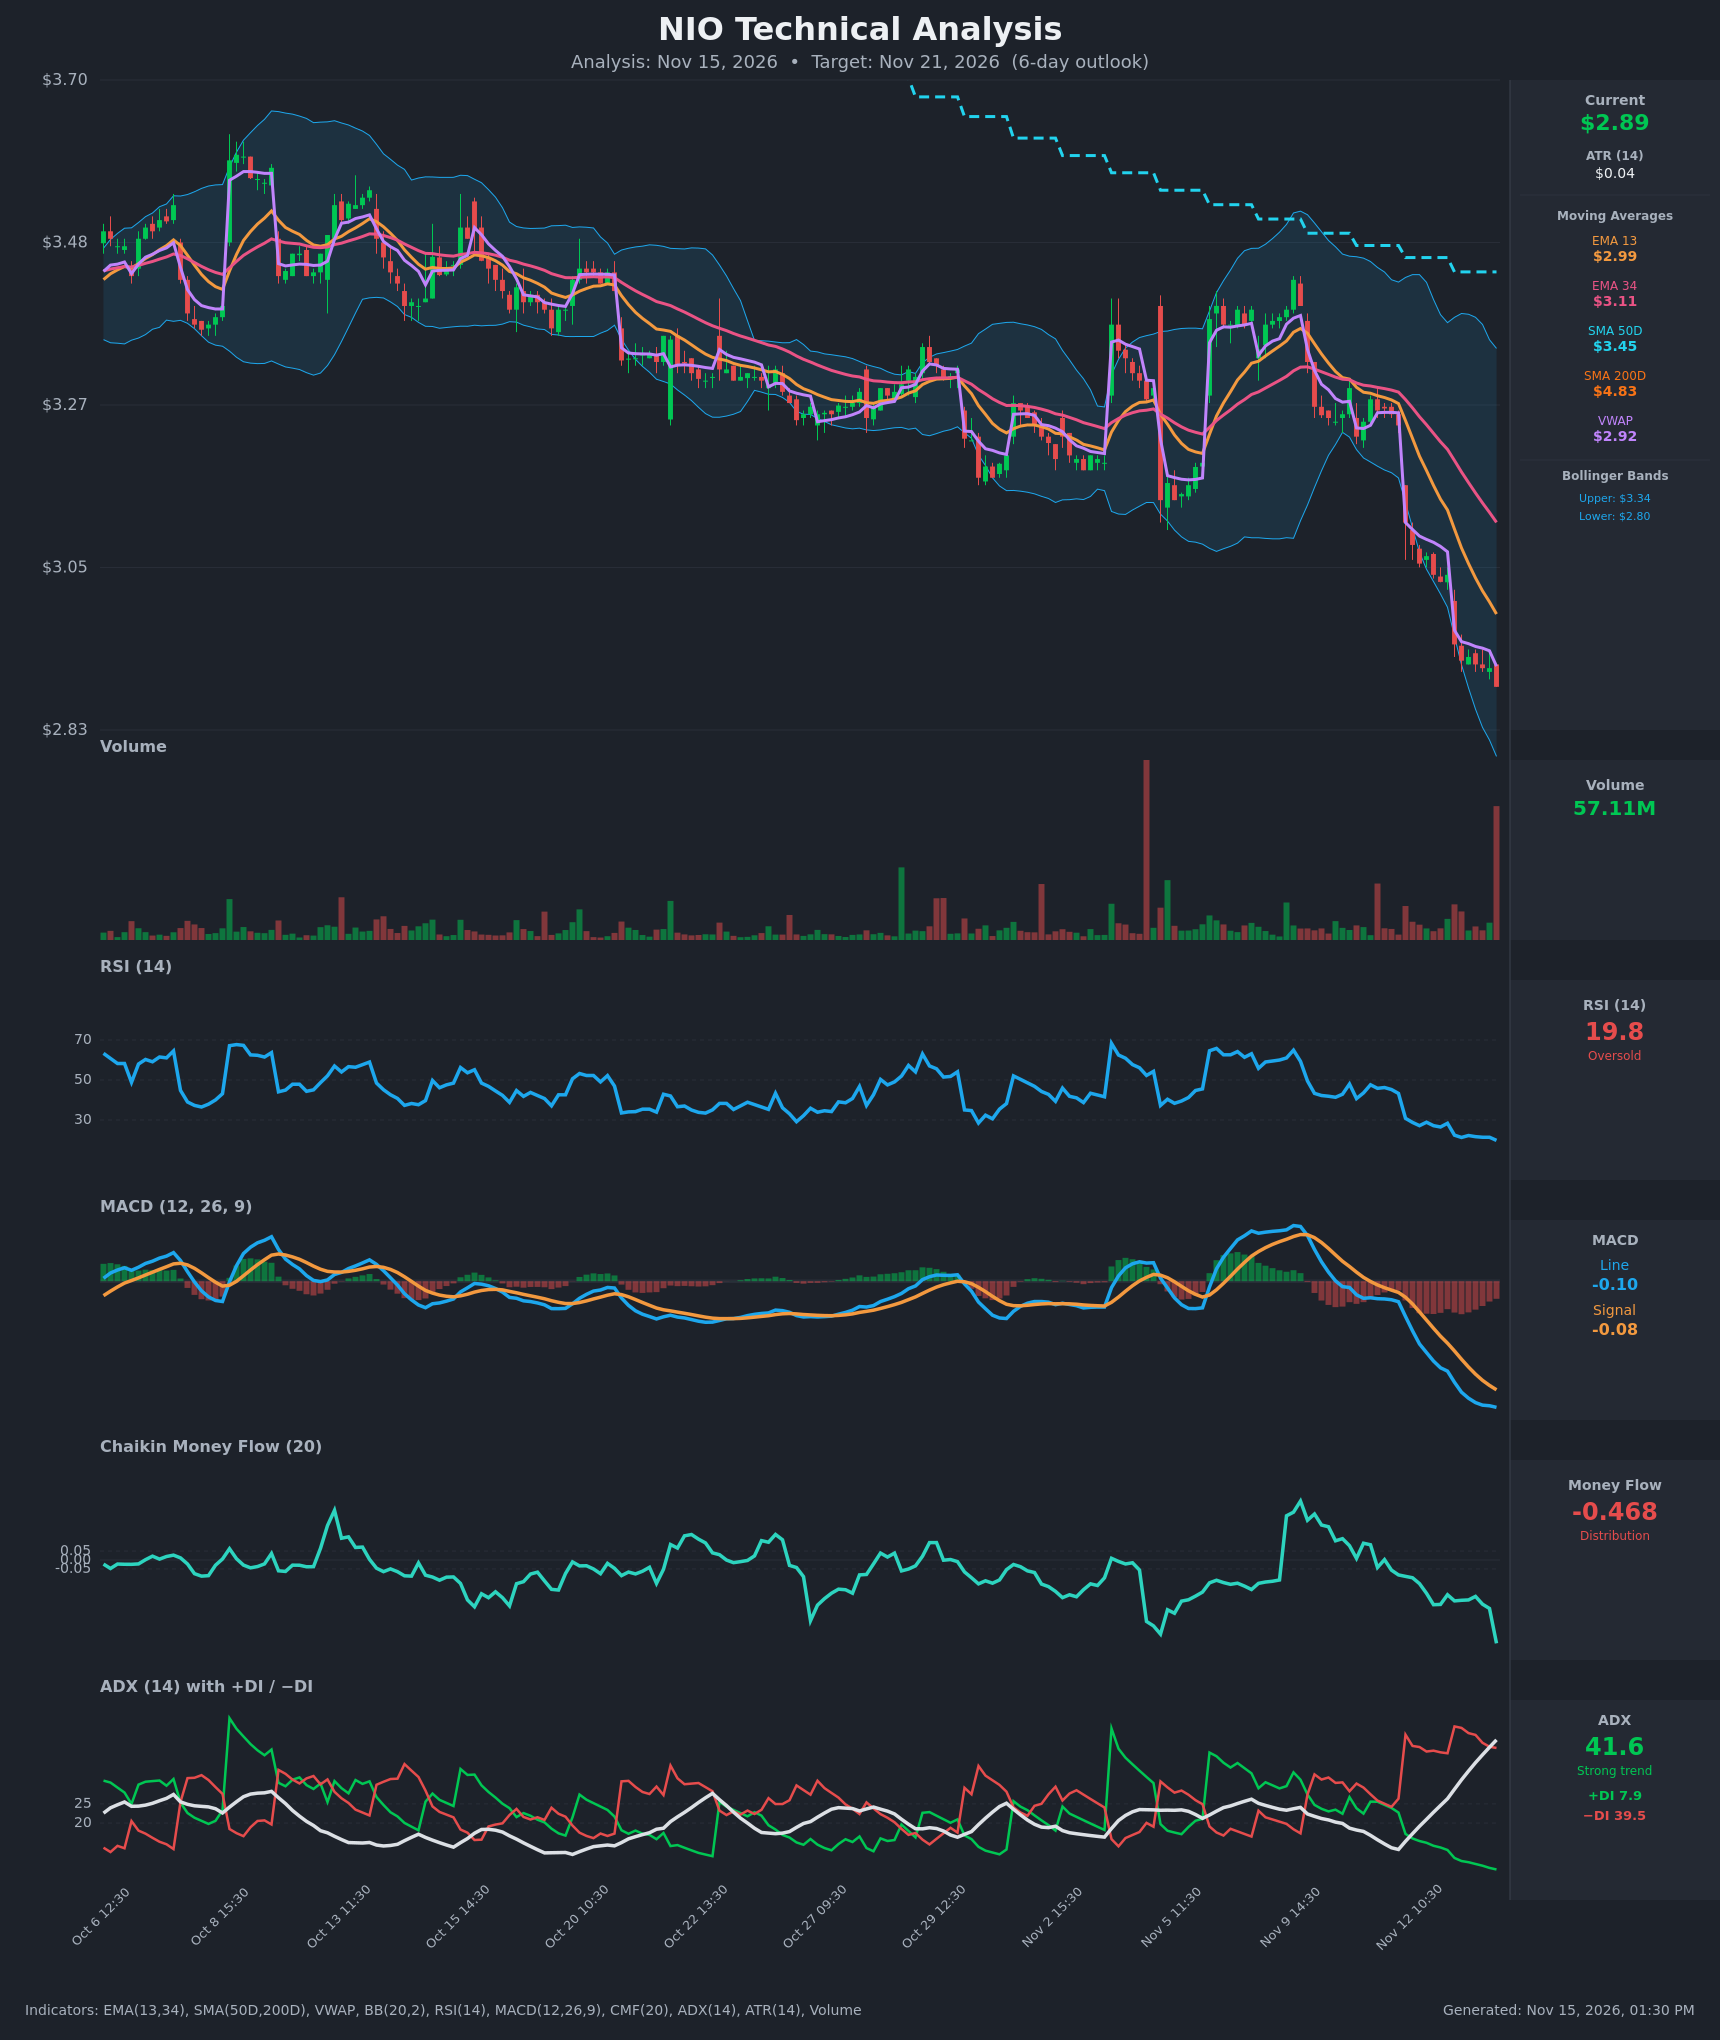
Analysis
TECHNICAL INDICATORS
- RSI (14): 19.81, deeply oversold (below 30 since Nov 13 open) and still making new lows, falling from 43 on Nov 11. Oversold readings in a strong trend can persist, but a snap-back bounce is increasingly likely. [Bearish]
- 20 EMA: The supplied values are EMA 13 at $2.9875 and EMA 34 at $3.1102. Price at $2.89 is below both, and the EMAs are sloping down steeply. EMA 13 crossed under EMA 34 around Nov 11-12, a bearish crossover, so the EMAs act as overhead resistance. [Bearish]
- MACD: Line -0.0972 is below signal -0.0837, with a negative and widening histogram of about -0.013. The bearish crossover happened on Nov 11-12 and both lines are accelerating lower, with no sign of a turn. [Bearish]
- Bollinger Bands (20): Upper $3.3432, lower $2.7968. Price at $2.89 is in the lower part of the band, close to it, after "walking" the lower band down. The bands are widening from the selloff, which signals expanding volatility to the downside. A tag of $2.80 is possible, and mean-reversion bounces are common from there. [Bearish]
- CMF (20): -0.468, far below the -0.05 threshold and plunging in the last bar (from -0.272). This is heavy distribution and selling pressure, and extremely negative. [Distribution]
- ADX (14): 41.6 and rising steadily from 13 on Nov 11, so the trend is strong. −DI at 39.5 is far above +DI at 7.9, with bears in full control. +DI is nearly flat-lined. [Strong Trend – Bearish]
- Volume: 57.11M on the latest bar, the largest spike on the chart apart from one earlier outlier, and it came on a red candle breaking to new lows. It confirms selling pressure, though it could also mark the start of capitulation. [Bearish – heavy distribution, possible climax]
DIVERGENCES & TRENDS
- No bullish RSI or MACD divergence is visible. RSI (19.8) and MACD are both making new lows alongside price, so momentum confirms the downtrend rather than diverging from it.
- Price is below every moving average: EMA 13 ($2.99), EMA 34 ($3.11), VWAP ($2.92), SMA 50D ($3.45) and SMA 200D ($4.83). The SMA 50D is well below the SMA 200D, an established death-cross structure and a long-term downtrend.
- ADX rose from 13 to 41.6 in about 15 hourly bars, a rapid trend acceleration. −DI crossed above +DI on Nov 11-12 and the gap has kept widening.
- Price has been below VWAP since Nov 13, which shows persistent selling.
- A rebound would first show up as RSI curling up from below 20 with a MACD histogram that stops widening. Neither has appeared yet.
CHART PATTERNS
- Price formed a lower-high, lower-low staircase from the early-November peak (~$3.40), then broke down sharply from the consolidation of Nov 9-12. This resembles a Bearish Flag / Pennant continuation from the reference diagram, and it also fits the broader descending-channel structure.
- The measured-move target of the flag points to roughly $2.75-$2.80, which coincides with the lower Bollinger Band ($2.80).
- There is no reversal pattern yet, such as a double bottom, inverted head and shoulders or falling wedge. The decline is vertical and has not formed a base.
- A bounce would likely be a relief rally into the $2.92-$2.99 resistance cluster (VWAP and EMA 13).
POTENTIAL SCENARIOS
- Scenario 1: Bearish Trend Continuation — Strong ADX with −DI dominance, deeply negative CMF and a heavy-volume breakdown favor a further drift lower toward the lower Bollinger Band and the flag measured move. Trigger: a hold below VWAP ($2.92) and a break of $2.85 on volume. Target: $2.78-$2.80, with an extension to $2.70. Invalidation: a close back above $2.99 (EMA 13). (50% probability)
- Scenario 2: Bullish Oversold Relief Bounce — RSI near 20 and a volume spike (possible capitulation) invite a mean-reversion bounce. Trigger: an hourly close above $2.92 (VWAP) with RSI turning up and the MACD histogram shrinking. Target: $2.99-$3.05 (EMA 13, then the EMA 34 area). Invalidation: a rejection at VWAP/EMA 13 and a fresh low below $2.80. (35% probability)
- Scenario 3: Neutral Basing Chop — Price stabilizes after the selloff and ranges between $2.80 and $2.95 while indicators reset. Trigger: shrinking volume and a flat RSI. Target: $2.85-$2.92. Invalidation: a decisive break outside the range. (15% probability)
PRICE TARGETS
- Target Price: $2.80 (6-day horizon)
- Expected Range: $2.70 to $2.93 (width $0.23, about 8% of the current price, in line with the 4-8% guidance for a ~6-day horizon)
- Key Levels: Support at $2.80 (lower Bollinger Band), Resistance at $2.99 (EMA 13; VWAP at $2.92 is the first hurdle)
OVERALL BIAS
OVERALL BIAS: BEARISH - ADX of 41.6 with −DI far above +DI, a bearish MACD, price below all moving averages and VWAP, and heavy distribution (CMF -0.468) outweigh the oversold RSI. Conviction is modest because a relief bounce from RSI 19.8 is a real risk, so a drift toward $2.80 is the more likely path.
This is educational analysis and not financial advice.