NIO 4-day bearish forecast — Nov 15, 2026
- Bias: Bearish
- Timeframe: 4 days (made Nov 15, 2026, target date Nov 18, 2026)
- Price at analysis: $2.89
- Price target: $2.83
- Expected range: $2.76 – $2.95
- Result: Pending — graded after the close on Nov 18, 2026
Get a free AI analysis of NIO today
Analysis
TECHNICAL INDICATORS
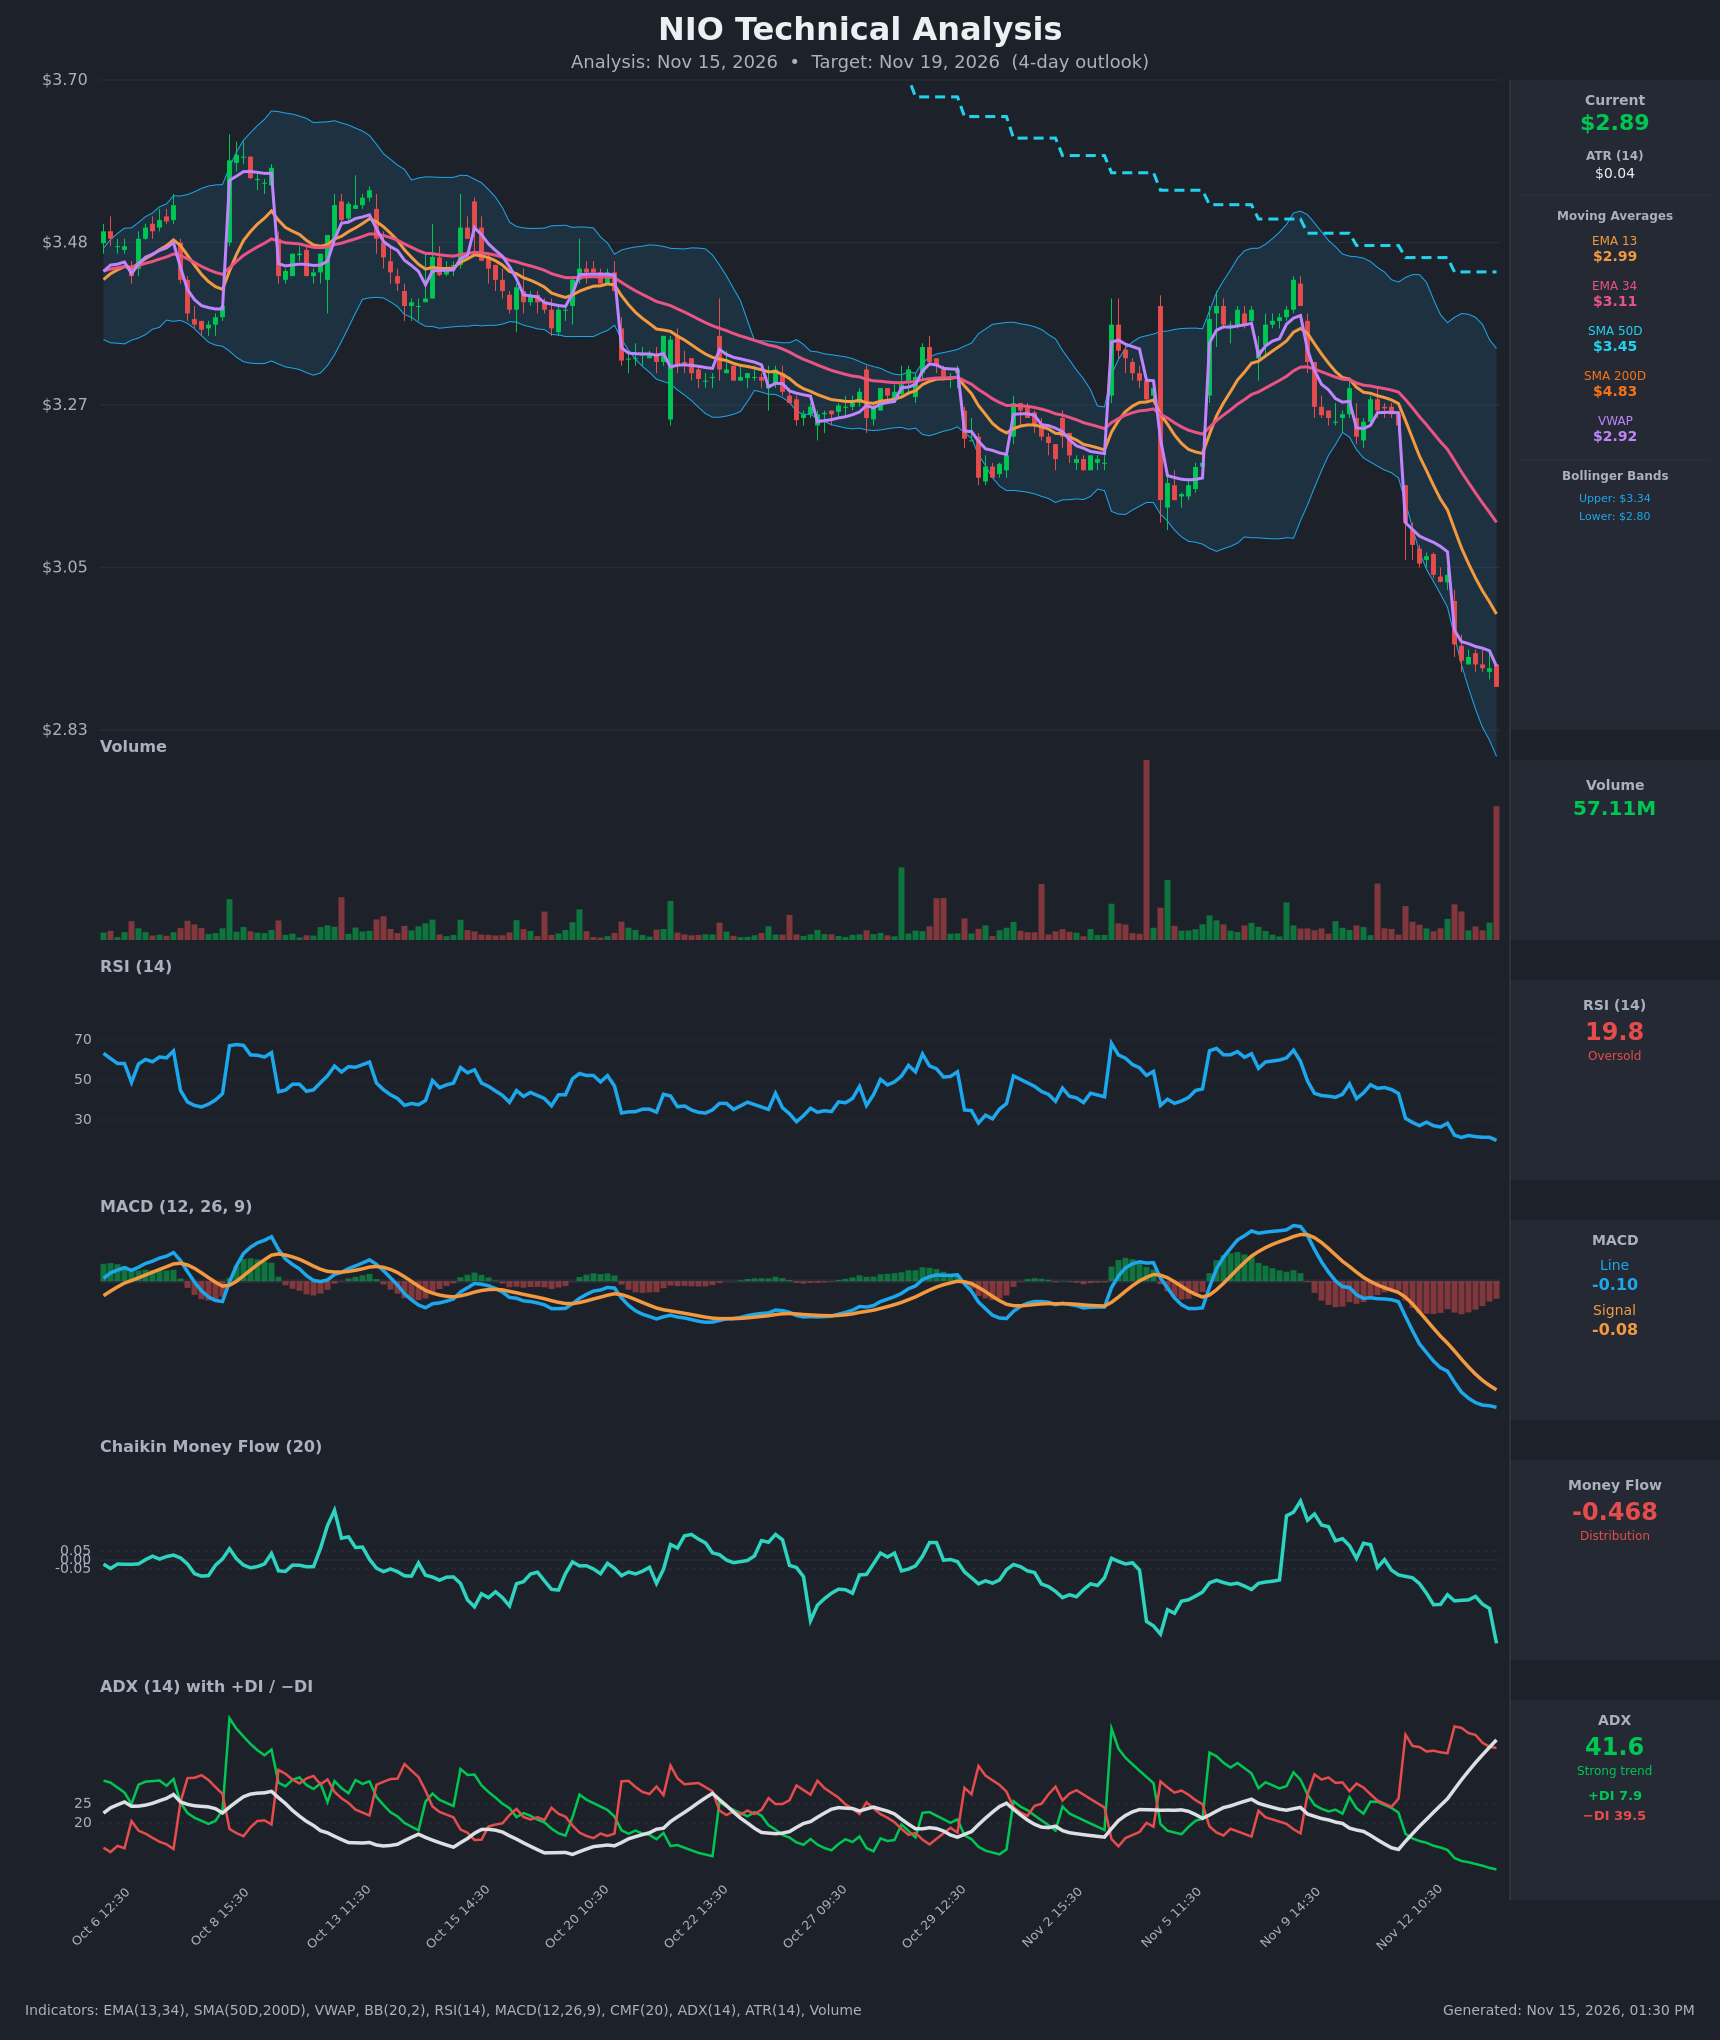
- RSI (14): 19.81, deeply oversold and still making new lows (it was 43 on Nov 11 and has fallen steadily). This signals stretched downside momentum and bounce risk, but there is no bullish turn yet. [Bearish]
- 20 EMA: The data gives EMA 13 at $2.9875 and EMA 34 at $3.1102. Price at $2.89 is below both, and EMA 13 has been below EMA 34 since Nov 11. Both slope down and act as overhead resistance. [Bearish]
- MACD: Line -0.0972 is below signal -0.0837, with a negative and widening histogram. The line has been under the signal since Nov 11 and is far below zero. This is a bearish crossover with no sign of momentum recovery. [Bearish]
- Bollinger Bands (20): Upper $3.3432, lower $2.7968. Price is hugging the lower band after a sharp expansion of the bands on the selloff. Walking the lower band is a trend-continuation sign, but a close this stretched often brings a snap-back toward the mid-band. [Bearish]
- CMF (20): -0.468, far below the -0.05 threshold. It has been negative for the entire recent window and dropped sharply on the last bar, which shows heavy distribution. [Distribution]
- ADX (14): 41.6 and rising from 13 in just 15 bars. −DI at 39.5 is far above +DI at 7.9, so sellers have complete control of a strong, accelerating downtrend. [Strong Trend - Bearish]
- Volume: 57.11M on the last bar is the largest of the recent window and came on a red candle breaking to new lows. That reads as heavy selling and possible capitulation, though it is not yet confirmed by a reversal candle. [Bearish with capitulation risk]
DIVERGENCES & TRENDS
- No bullish divergence yet: RSI, MACD and CMF all made new lows alongside price, so the indicators confirm the move rather than diverge from it.
- Moving averages: Price is below EMA 13 ($2.99), EMA 34 ($3.11), SMA 50D ($3.45) and SMA 200D ($4.83). SMA 50D is far below SMA 200D, so the death cross is long established. EMA 13 is below EMA 34, a bearish alignment with widening spacing.
- VWAP: Price at $2.89 is below VWAP at $2.92, a mild sign of seller control.
- Momentum trend: ADX is accelerating and −DI is well above +DI (39.5 vs 7.9). MACD is still widening to the downside and CMF is plunging, so momentum is not yet exhausted.
- Exhaustion warning: RSI near 20 and price at the lower Bollinger Band make a relief bounce plausible. In strong trends (ADX above 40), however, RSI can stay oversold for days.
CHART PATTERNS
- No clean textbook reversal: There is no confirmed bullish reversal pattern from the reference diagram (no double bottom, inverted H&S or falling wedge reversal), and no bullish candle or divergence confirmation.
- Range breakdown: The price broke down from a $3.10–$3.40 consolidation (similar to a bearish pennant or flag breakdown) with a steep, near-vertical decline. Since the Nov 9–10 breakdown, price has made successive lower lows and lower highs, so the continuation bias favors the downside.
- Downside target: The measured move from the consolidation breakdown suggests the $2.75–$2.85 area, consistent with the lower Bollinger Band at $2.80.
- Caveat: A steep, accelerating selloff with a volume spike can end in a short-term capitulation bottom, and the 4-day window could include a sharp relief rally.
POTENTIAL SCENARIOS
- Scenario 1: Bearish Trend Continuation — Sellers remain in control (ADX 41.6, −DI 39.5, CMF -0.47, MACD widening). Price grinds lower along the lower Bollinger Band and stalls near the $2.80 level. Trigger: failure to reclaim VWAP at $2.92 and a break below $2.85. Target: $2.78–$2.83. Invalidation: a strong hourly close above $2.99 (EMA 13). (50% probability)
- Scenario 2: Bullish Oversold Relief Bounce — RSI near 20 and a capitulation-style volume spike trigger short covering and mean reversion toward VWAP and EMA 13. Trigger: a bullish hourly reversal candle with a close above $2.92 and a rising RSI. Target: $2.95–$3.00, with a bounce likely to be sold at the declining EMA 13. Invalidation: a break below $2.80 on volume. (35% probability)
- Scenario 3: Neutral Basing Chop — Price stabilizes after the spike and trades sideways between $2.80 and $2.95 as momentum cools. Trigger: shrinking volume and a flat RSI near 20–25. Target: $2.85–$2.92. Invalidation: a close outside the $2.78–$2.97 range. (15% probability)
PRICE TARGETS
- Target Price: $2.83 (4-day horizon)
- Expected Range: $2.76 to $2.95 (width $0.19, about 6.6% of the current price, within the guidance for a 4-day timeframe)
- Key Levels: Support at $2.80, Resistance at $2.92
OVERALL BIAS
OVERALL BIAS: BEARISH - Price sits below every moving average and VWAP, with MACD below its signal, CMF at -0.47 and ADX at 41.6 with −DI dominant. The oversold RSI (19.8) raises bounce risk, but with no divergence or reversal confirmation the trend favors further modest downside toward $2.80.
This is educational analysis and not financial advice.