PFE 6-day bearish forecast — Nov 15, 2026
- Bias: Bearish
- Timeframe: 6 days (made Nov 15, 2026, target date Nov 20, 2026)
- Price at analysis: $28.90
- Price target: $28.60
- Expected range: $27.95 – $29.75
- Result: Pending — graded after the close on Nov 20, 2026
Get a free AI analysis of PFE today
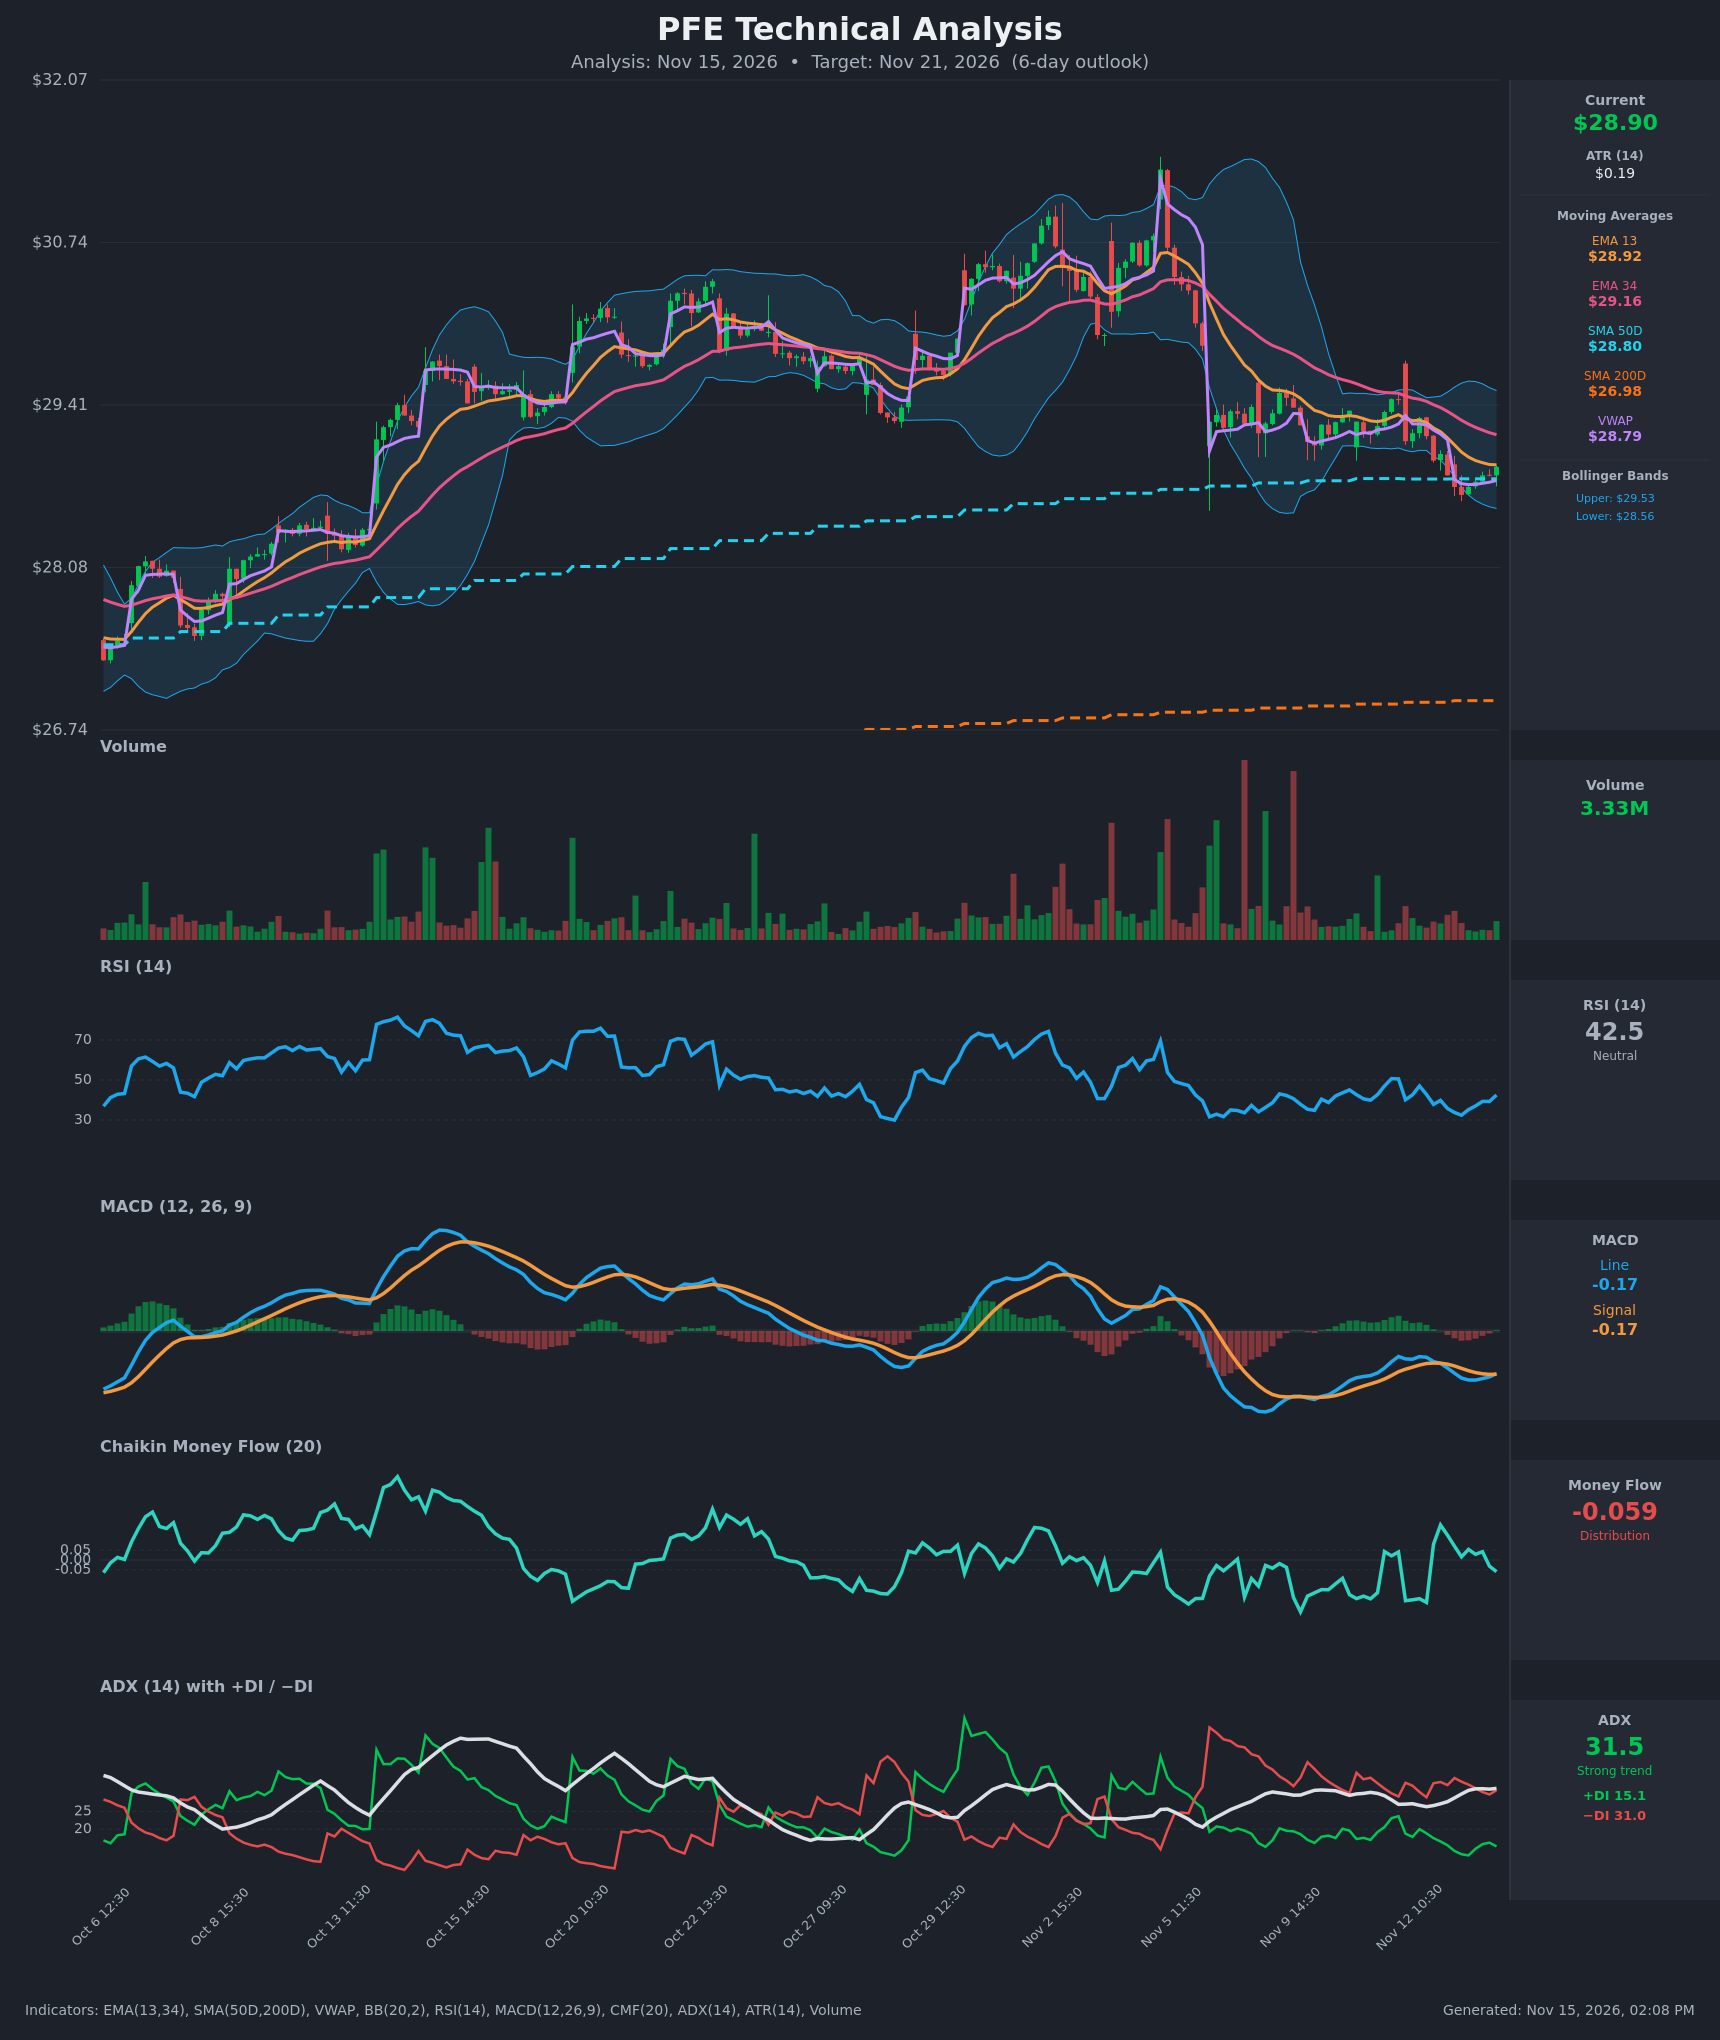
Analysis
TECHNICAL INDICATORS
- RSI (14): 42.5, up from a low of ~32 on Nov 13 morning but still below 50. It was oversold-adjacent earlier in the week and is now making a modest recovery without confirming a reversal. [Neutral]
- 20 EMA: The chart shows EMA 13 at $28.92 and EMA 34 at $29.16. Price ($28.90) sits just under the EMA13 and below the EMA34. EMA13 is below EMA34, a bearish alignment, and both slope down. The EMAs act as overhead resistance. [Bearish]
- MACD: Line -0.168 vs. signal -0.171, so the line is just barely above the signal after a small bullish cross on the last bar. The histogram is nearly flat, around zero. Both lines are negative, so momentum is weak, but the downside is flattening. [Neutral]
- Bollinger Bands (20): Upper $29.53, lower $28.56, mid ≈ $29.04. Price is $28.90, below the midline and in the lower half of the bands. Bandwidth is fairly narrow, around 3.3%, which fits a compression phase. Price bounced off the lower band area. [Neutral]
- CMF (20): -0.059, just below the -0.05 threshold. It rolled over from positive readings earlier in the session and is consistent with mild distribution. [Distribution]
- ADX (14): 31.5 with +DI 15.1 and −DI 31.0. The trend is strong and bears are firmly in control, with −DI at about twice +DI. ADX is flat to slightly rising. [Strong Trend – Bearish]
- Volume: 3.33M on the latest bar, which is light compared with the heavy red-volume spikes in the Nov 5–9 selloff. The recent decline is occurring on fading volume, so selling pressure is easing but buyers aren't stepping in with conviction. [Neutral / Fading selling]
DIVERGENCES & TRENDS
- There is a mild bullish divergence on short-term momentum: MACD and RSI have turned up off their lows while price has made a marginally lower low. The divergence is not strong enough to confirm a reversal.
- Price is in a clear downtrend from the ~$31.5 peak around Nov 5, with lower highs and lower lows. EMA13 is below EMA34, the trend is capped by the EMA34 (~$29.16), and VWAP ($28.79) is slightly below price.
- Price is holding close to the SMA50D ($28.80), which is the key support. SMA200D ($26.98) is far below, so the longer-term trend is still up and no death cross is in play.
- A small MACD bullish crossover just occurred. It is weak because it is occurring below zero.
- ADX at 31.5 with −DI dominant confirms the downtrend. A DI crossover is not close.
CHART PATTERNS
- The recent action best matches a Bullish Flag / Falling Wedge-style consolidation within a broader pullback, as price grinds lower within a descending channel after the sharp drop from $31.5. A break above the EMA34 (~$29.16) and the upper channel would open a bounce toward $29.50.
- Alternatively, the sequence of lower highs resembles a Descending Triangle or bearish continuation against SMA50D support. A close below $28.56 (lower BB) and $28.80 (SMA50D) would activate downside targets near $28.2.
- Neither pattern is decisive. ADX and DI favor bearish continuation, while the SMA50D, flat MACD histogram and oversold-ish RSI argue for a base.
POTENTIAL SCENARIOS
- Scenario 1: Bearish Trend Continuation — Bears keep control with −DI dominant and ADX above 30. Price loses the SMA50D and lower Bollinger Band and drifts lower. Trigger: Close below $28.56. Target: $28.30–$28.40. Invalidation: Close above $29.16 (EMA34). (45% probability)
- Scenario 2: Neutral Range Consolidation — Price stays pinned between the lower BB/SMA50D support and the EMA13/EMA34 resistance while MACD flattens. Trigger: Holds $28.60–$29.15. Target: $28.80–$29.00. Invalidation: Break outside the $28.55–$29.20 range. (30% probability)
- Scenario 3: Bullish Relief Bounce — A MACD bullish cross and RSI rebound push price back toward the mid-band and EMA34. Trigger: Close above $29.05 with rising volume. Target: $29.35–$29.50. Invalidation: Close below $28.56. (25% probability)
PRICE TARGETS
For a 6-day timeframe, the range width should be roughly 4–8% of the current price. The expected range is $27.95 to $29.75, a width of $1.80, or about 6.2% of $28.90.
- Target Price: $28.60 (6-day)
- Expected Range: $27.95 to $29.75
- Key Levels: Support at $28.56 (lower Bollinger Band; SMA50D at $28.80 is the first layer), Resistance at $29.16 (EMA34)
OVERALL BIAS
OVERALL BIAS: BEARISH - ADX of 31.5 with −DI (31.0) far above +DI (15.1), EMA13 below EMA34, and CMF slipping into distribution all favor trend continuation. The price sits just above the SMA50D and lower Bollinger Band, so a break of $28.56 should open a drift toward $28.30–$28.60. Fading volume and a flattening MACD limit conviction.
This is educational analysis and not financial advice.