PFE 4-day bearish forecast — Nov 15, 2026
- Bias: Bearish
- Timeframe: 4 days (made Nov 15, 2026, target date Nov 18, 2026)
- Price at analysis: $28.90
- Price target: $28.72
- Expected range: $28.30 – $29.30
- Result: Pending — graded after the close on Nov 18, 2026
Get a free AI analysis of PFE today
Analysis
TECHNICAL INDICATORS
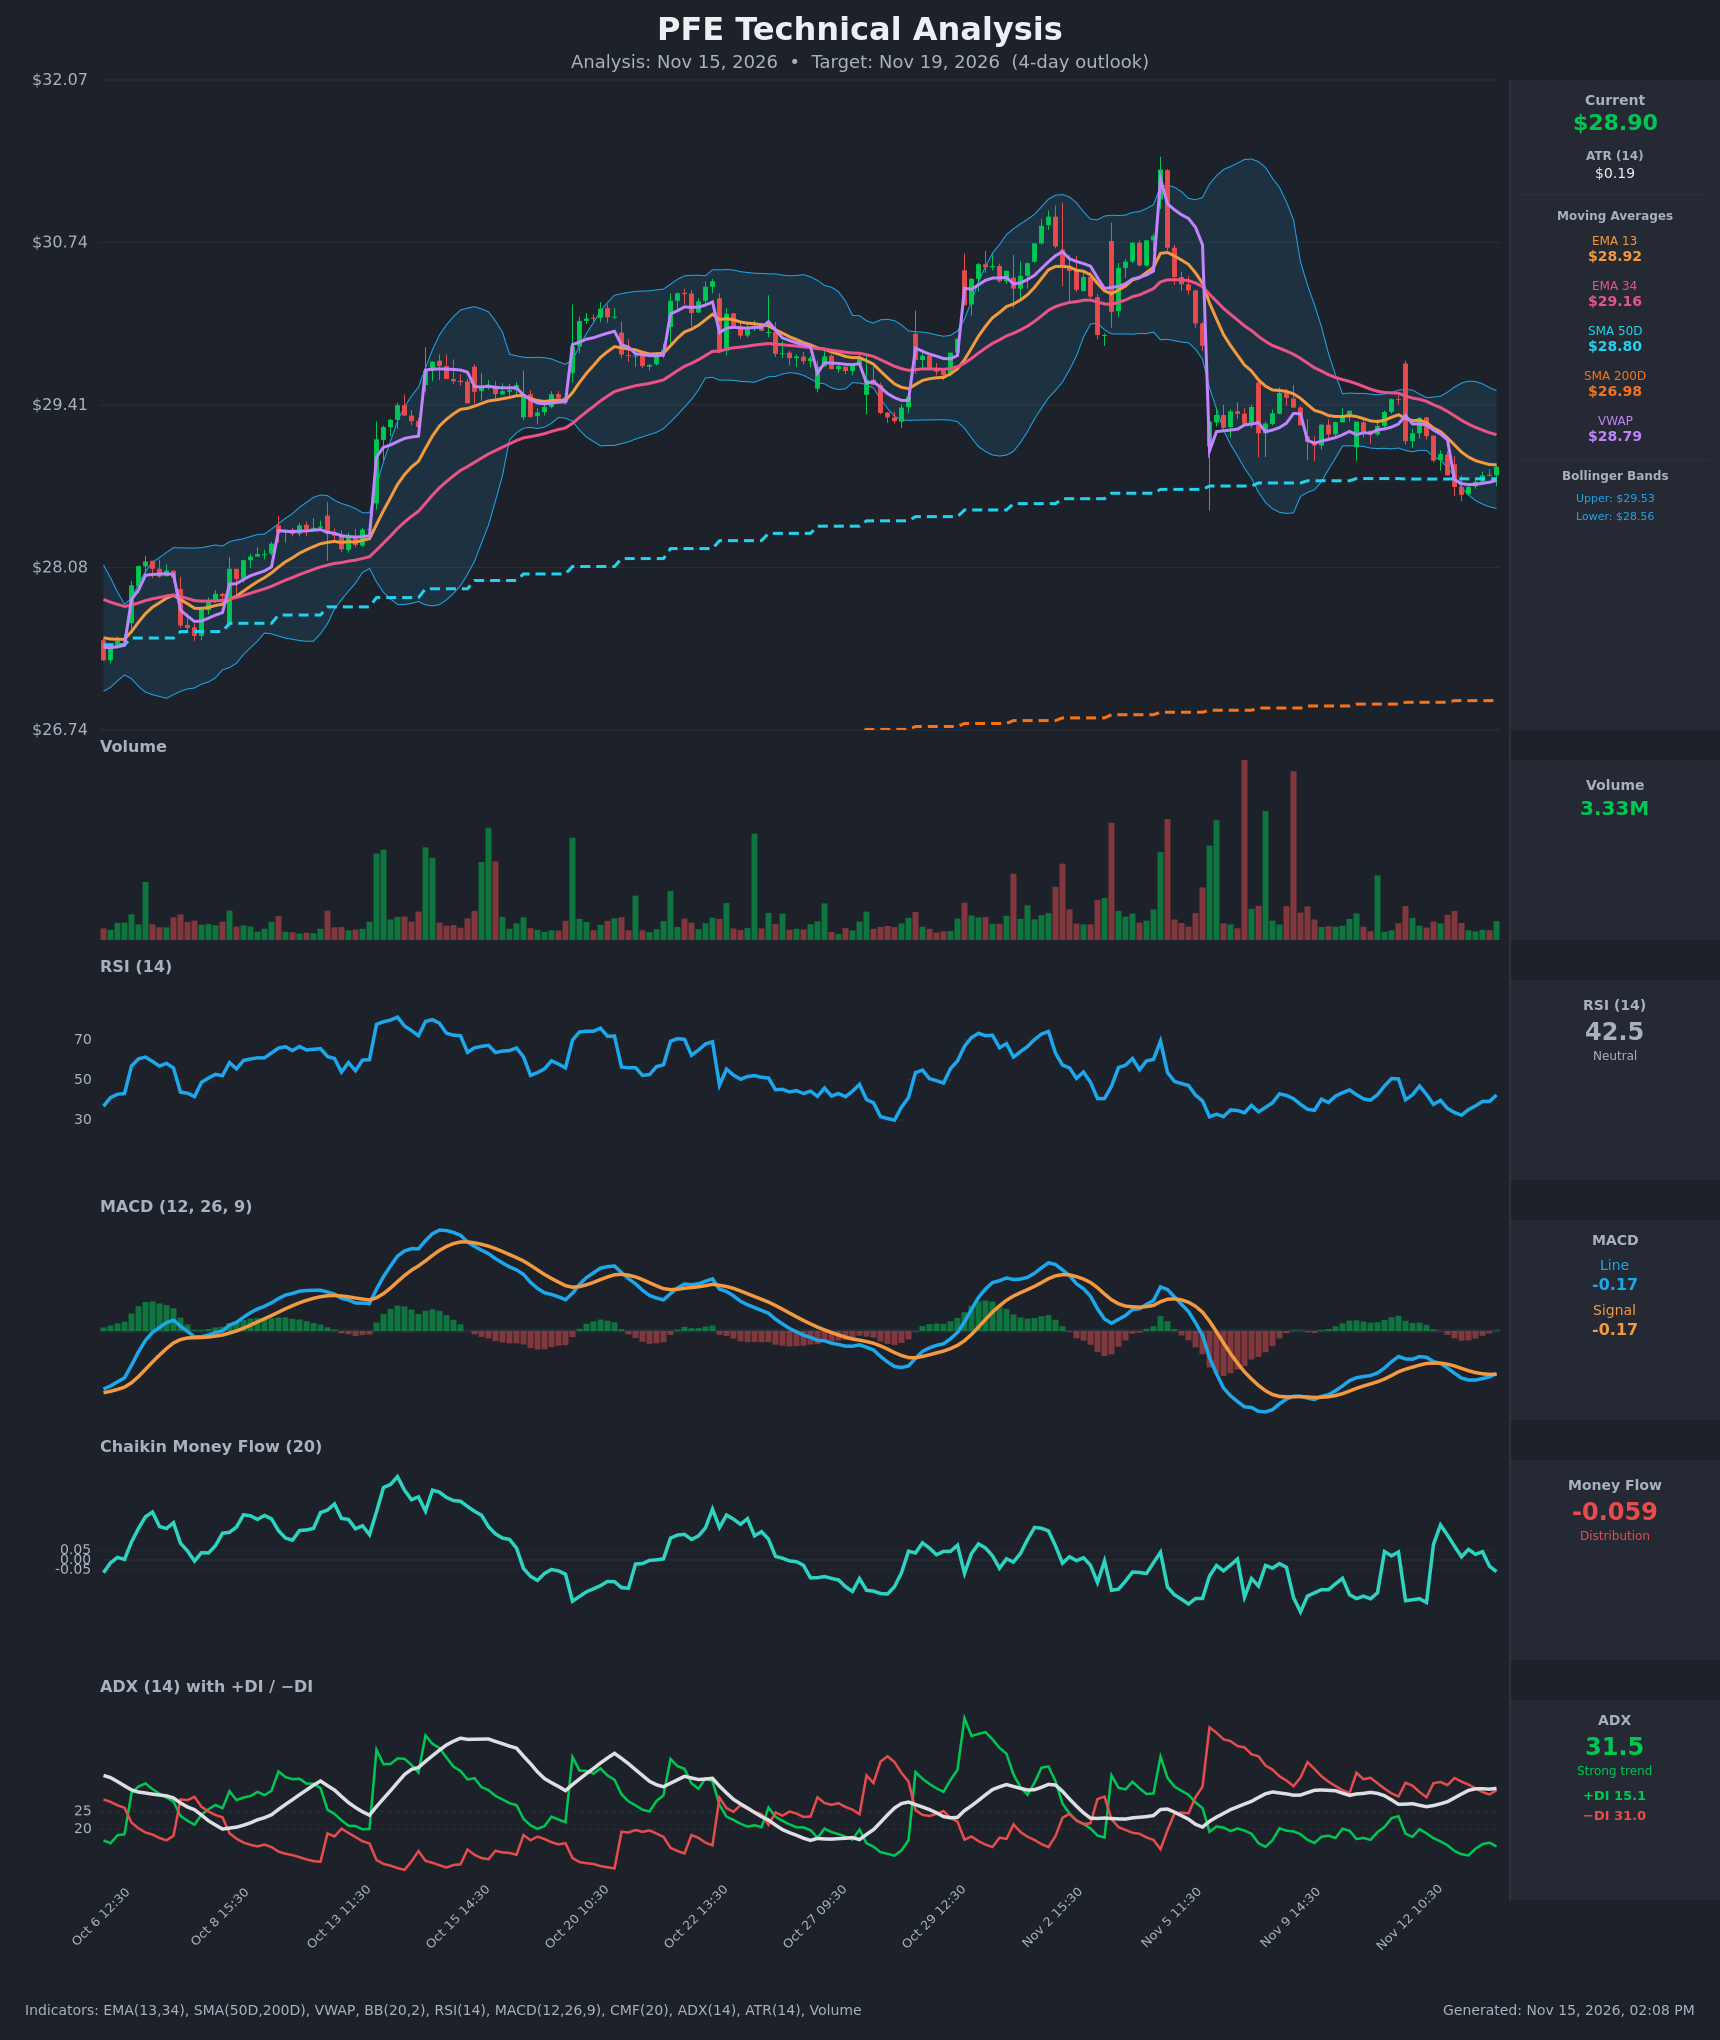
- RSI (14): 42.5, up from a low near 32 on Nov 13 (10:30). It is bouncing from near-oversold but still below 50, so momentum is recovering inside a bearish regime. [Neutral]
- 20 EMA: The data gives EMA 13 at $28.92 and EMA 34 at $29.16. Price ($28.90) sits just under EMA 13 and well under EMA 34, which is falling and acting as resistance. EMA 13 is below EMA 34, a bearish alignment. [Bearish]
- MACD: Line -0.168 versus signal -0.171. The line just crossed above the signal and the histogram is barely positive. Both lines are still negative and near their recent lows, so this is a weak early bounce signal. [Neutral]
- Bollinger Bands (20): Upper $29.53, lower $28.56, midline about $29.04. Price is in the lower half of the bands after riding the lower band. Bandwidth is moderate. A move back to the midline is possible, but the downtrend has been walking the lower band. [Bearish]
- CMF (20): -0.059, just below the -0.05 threshold. It has rolled over from positive readings, which points to mild distribution. [Distribution]
- ADX (14): 31.5 and rising, with -DI (31.0) far above +DI (15.1). This is a strong, established downtrend with bears firmly in control. [Strong Trend - Bearish]
- Volume: 3.33M, light compared with the heavy red volume spikes around the Nov 5 gap-down. The recent bounce is on thin volume, so buyers are not showing conviction. [Weak bounce / bearish-leaning]
Other levels: price is above SMA 50 ($28.80) and VWAP ($28.79), which together form a support cluster just below. It is well above SMA 200 ($26.98), so the long-term trend is still up while the short-term trend is down.
DIVERGENCES & TRENDS
- No clear divergence. RSI made a higher low (about 32 at the Nov 13 low) while price made new lows near $28.67, which is a mild bullish hint but not a confirmed divergence.
- The Nov 5 gap-down broke price below both EMAs, and EMA 13 has been below EMA 34 since. Lower highs and lower lows have followed.
- The MACD bullish crossover is minor and happens below the zero line, so it is low-quality.
- ADX has climbed from about 20 to 31.5 with -DI dominant, which confirms a trending decline rather than a range.
- CMF has been mostly negative or flat since early November, which matches the selling pressure.
- Price is sitting on the SMA 50 / VWAP support cluster ($28.79-$28.80) and is the key level to watch.
CHART PATTERNS
- Bearish flag / descending channel: After the sharp Nov 5 drop, price drifted sideways to lower in a tight range ($29.50 to $28.70), then rolled over. This resembles a bearish flag or pennant continuation, whose measured move points lower.
- A bullish falling wedge or a double bottom near $28.67-$28.70 is a possible counter-read, but neither is confirmed. There is no breakout above the neckline and no volume expansion.
- The pattern target is roughly a break below $28.56, with the next area near $28.30 for a 4-day move.
POTENTIAL SCENARIOS
- Scenario 1: Bearish Trend Continuation — The strong ADX and -DI dominance, price below the falling EMAs, and distribution in CMF keep sellers in control. Price loses the SMA 50 / VWAP cluster and probes the lower Bollinger Band. Trigger: hourly close below $28.78. Target: $28.55-$28.30. Invalidation: close above $29.16 (EMA 34). (50% probability)
- Scenario 2: Bullish Relief Bounce — The RSI recovery and fresh MACD cross lift price from the SMA 50 / VWAP support to the Bollinger midline and EMA 34. Trigger: hourly close above $29.05 with rising volume. Target: $29.16-$29.40. Invalidation: close below $28.67. (35% probability)
- Scenario 3: Neutral Chop — Price oscillates between $28.70 and $29.10 as the bounce stalls near the moving averages and support holds. Trigger: no break of either level. Target: $28.85-$29.00. Invalidation: close outside $28.60-$29.20. (15% probability)
PRICE TARGETS
Range check: the 4-day range is $28.30 to $29.30, a $1.00 width (about 3.5% of $28.90). That fits the 2-4% guidance for a short timeframe and is consistent with the ATR of $0.19 (a 4-day move of about $0.40 on either side of the target).
- Target Price: $28.72 (4 days out)
- Expected Range: $28.30 to $29.30
- Key Levels: Support at $28.56 (lower Bollinger Band; interim support at the $28.79-$28.80 SMA 50 / VWAP cluster), Resistance at $29.16 (EMA 34)
OVERALL BIAS
OVERALL BIAS: BEARISH - ADX of 31.5 with -DI (31.0) far above +DI (15.1), price below the falling EMA 34, CMF in mild distribution, and a bounce on light volume outweigh the minor MACD crossover and RSI recovery. Expect a probe of the $28.56 lower band, with $29.16 as the level that would invalidate the call.
This is educational analysis and not financial advice.