EEM 6-day bullish forecast — Nov 15, 2026
- Bias: Bullish
- Timeframe: 6 days (made Nov 15, 2026, target date Nov 20, 2026)
- Price at analysis: $60.92
- Price target: $61.50
- Expected range: $59.95 – $62.95
- Result: Pending — graded after the close on Nov 20, 2026
Get a free AI analysis of EEM today
Analysis
TECHNICAL INDICATORS
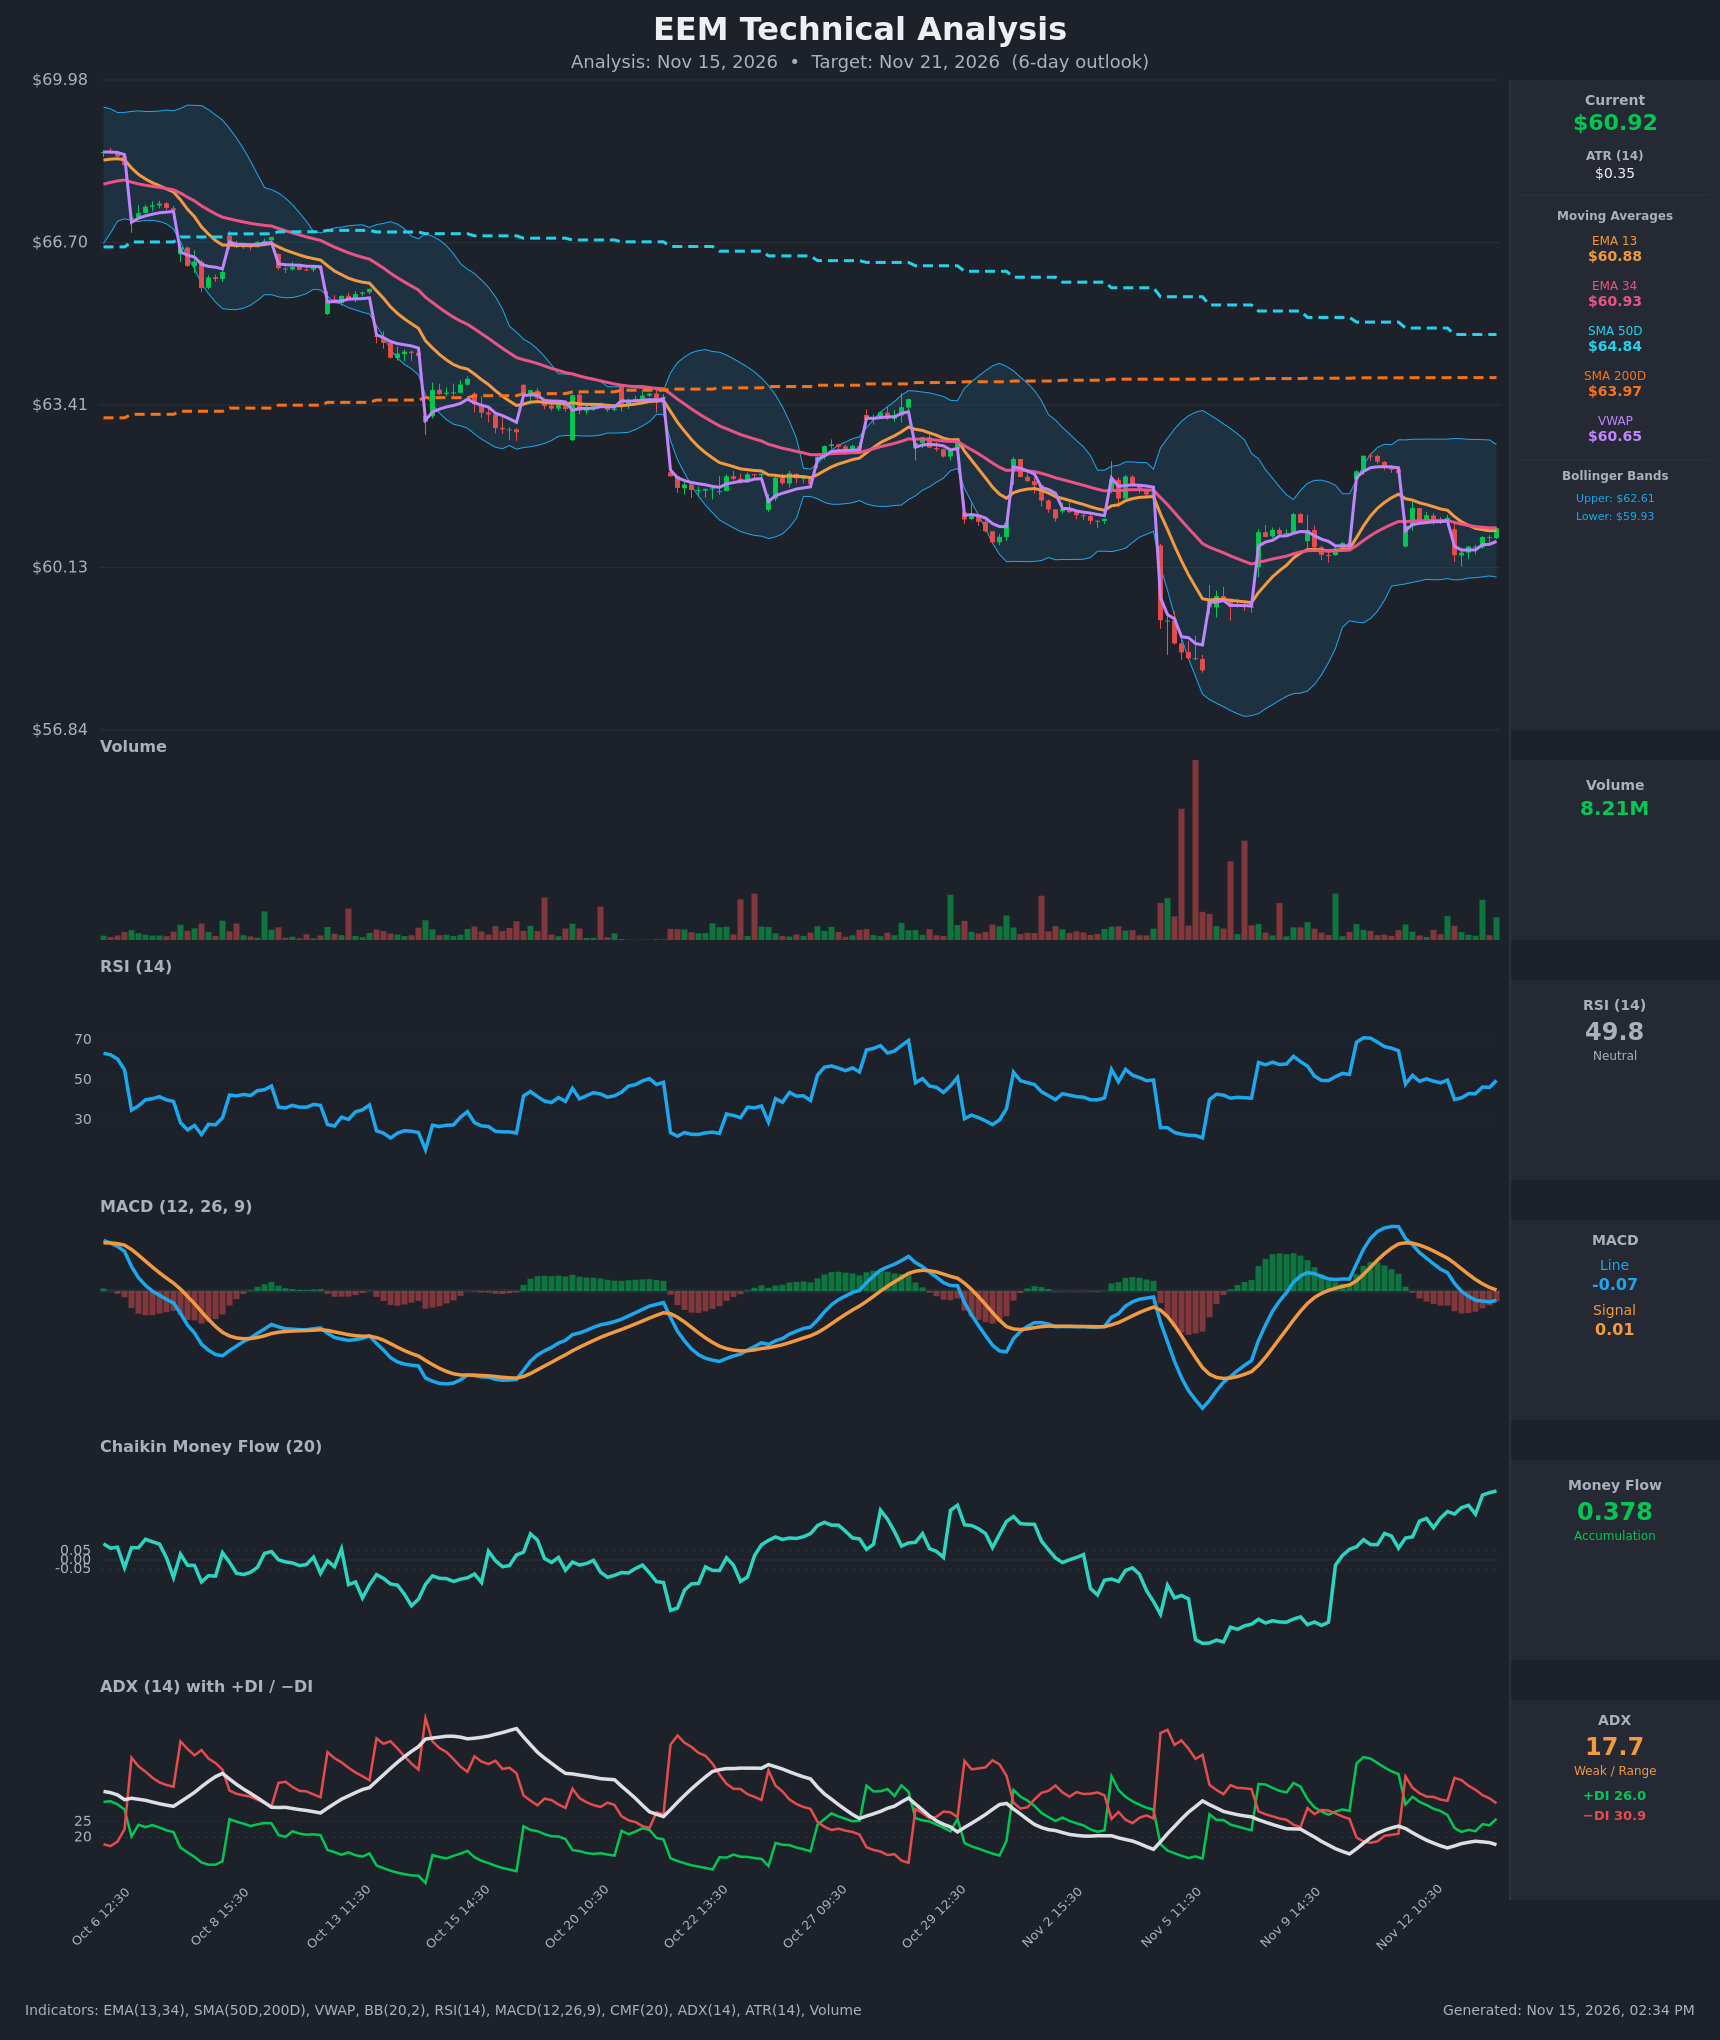
- RSI (14): 49.78, neutral. It has recovered from 40.2 on Nov 13 at the open and is rising, with no overbought or oversold condition. [Neutral]
- 20 EMA: The chart shows EMA 13 at $60.88 and EMA 34 at $60.93. Price at $60.92 sits right on both, and EMA13 is only just below EMA34, so there is no clear trend edge. Price recently reclaimed the EMA13 after trading below it. [Neutral]
- MACD: The line is -0.072 and the signal is +0.008, so the line sits below the signal. It crossed bearish on Nov 13 at about 10:30. The histogram is slightly negative (about -0.08) and the gap to the signal has narrowed over the last few bars. Momentum is soft but flattening. [Bearish]
- Bollinger Bands (20): Upper is $62.61 and lower is $59.93. Price is near the middle band, with a wide band (~$2.68), so volatility is elevated after the early-November flush. There is no squeeze or band-walk. [Neutral]
- CMF (20): 0.378, well above +0.05 and climbing steadily since Nov 6, when it was deeply negative. This is strong accumulation even though price has been flat to lower. [Accumulation]
- ADX (14): 17.7 with −DI (30.9) above +DI (26.0). The trend is weak or range-bound. The bears hold a slight edge, but the DI spread is narrowing (it was 39.0 vs 23.0 on Nov 13 at the open). [Weak Trend, slight bearish tilt]
- Volume: 8.21M, with recent bars near average and no capitulation-level spikes since the Nov 4-6 selloff. The green bars at the right edge show modest buying participation. Price is above VWAP ($60.65), which is mildly supportive. [Mildly Bullish]
DIVERGENCES & TRENDS
- Bullish CMF divergence: CMF is making new highs (0.378) while price remains near its recent range lows and below the late-October highs. This suggests accumulation under the surface.
- MACD: The bearish crossover is fresh but shallow. The histogram is contracting, so downside momentum is fading.
- Long-term trend: Price is below the SMA50 ($64.84, falling) and the SMA200 ($63.97). The structure is a persistent lower-high downtrend since early October. Both moving averages are overhead resistance, and price is about 5% below the SMA200.
- Short-term structure: Since the Nov 6 low near $58.5, price has made higher lows, but with a choppy range of roughly $60.3–$62.3.
- ADX/DI: The −DI lead is narrowing and ADX is falling, which points to a consolidation rather than a strong trend.
CHART PATTERNS
- Reference diagram match: The closest match is a Bullish Falling Wedge / Expanding Triangle (reversal) from the early-November flush. Price made a sharp low and has since recovered into a range of higher lows. It is not confirmed.
- Context: The larger trend is a descending channel of lower highs, similar to a bearish continuation structure. A break above ~$62.40 would be needed to damage that bearish structure.
- Targets: A breakout above $62.40 targets about $63.40–$64.00 (the SMA200 zone). A breakdown below $60.30 targets $59.30–$58.60.
POTENTIAL SCENARIOS
- Scenario 1: Bullish Accumulation Drift Higher — CMF accumulation and the recovering RSI support a grind toward the upper range as MACD histogram contraction turns into a bullish cross. Trigger: hold above $60.40 and close above $61.50 with MACD crossing back above signal. Target: $62.30–$62.60 (upper Bollinger Band). Invalidation: hourly close below $60.30. (45% probability)
- Scenario 2: Bearish Trend Resumption — The primary downtrend reasserts itself. The MACD bearish cross, −DI dominance and rejection at the EMAs push price back to the lower band. Trigger: break below $60.30 on rising volume. Target: $59.30–$59.90. Invalidation: close above $61.60. (30% probability)
- Scenario 3: Neutral Range Chop — Weak ADX keeps price between $60.30 and $62.00 and it finishes near the current level. Trigger: failure of both breakouts. Target: $60.70–$61.40. Invalidation: close outside $60.00–$62.60. (25% probability)
PRICE TARGETS
- Target Price: $61.50 (6-day)
- Expected Range: $59.95 to $62.95 (width $3.00, about 4.9% of current price, consistent with the 6-day timeframe)
- Key Levels: Support at $60.30, Resistance at $62.40
OVERALL BIAS
OVERALL BIAS: BULLISH - CMF shows strong accumulation (0.378) while price holds above VWAP, RSI is recovering from 40 and the MACD histogram is contracting. The bias is modest because price remains below the falling SMA50 and SMA200 and −DI is still above +DI.
This is educational analysis and not financial advice.